
1. Ashok Leyland Ltd
| Counter | ASHOKLEY LTP 181.9 |
| Call | Buy on dip |
| Target 1 | 197 |
| Target 2 | 210 |
| Stop Loss | 162 |
| Time Horizon | 3-4 weeks |
| Notes | Buy-on-dip towards 178 & Avg around 170 |
Ashok Leyland, flagship of the Hinduja group, is the 2nd largest manufacturer of commercial vehicles in India, the 4th largest manufacturer of buses in the world, and the 19th largest manufacturers of trucks. Headquartered in Chennai, 9 manufacturing plants gives an international footprint – 7 in India, a bus manufacturing facility in Ras Al Khaimah (UAE), one at Leeds, United Kingdom and a joint venture with the Alteams Group for the manufacture of high-press die-casting extruded aluminium components for the automotive and telecommunications sectors, Ashok Leyland has a well-diversified portfolio across the automobile industry. Ashok Leyland has recently been ranked as 34th best brand in India
| Previous Close | 175.5 | TTM EPS | 4.4 |
| 52 Week High | 183.2 | TTM PE | 41.0 |
| 52 Week Low | 133.1 | P/B | 6.24 |
| Sector PE | 52.3 | Mkt Cap (Rs. Cr.) | 53,393 |
(Source: Moneycontrol, BSE, Fisdom Research)
Technical Outlook
(Source: Fisdom Research)
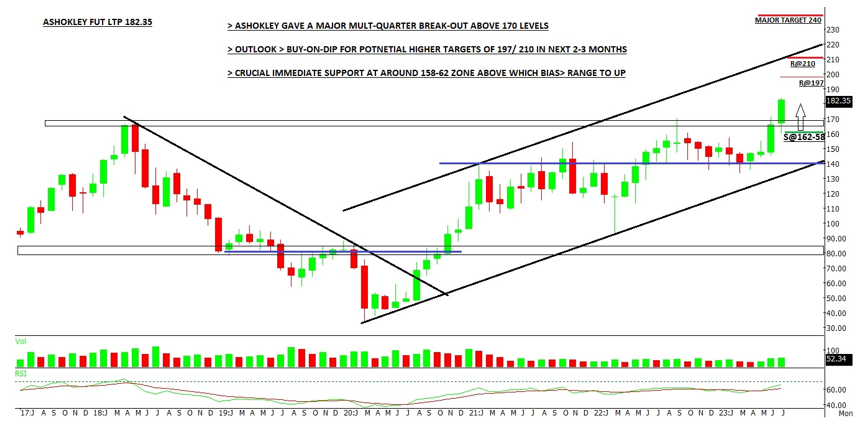
- Last week, Ashok Leyland’s weekly chart showed a significant breakout pattern called “Double Top.”
- According to technical analysis, Ashok Leyland can be considered for a “Buy-On-Dip” strategy, targeting higher levels of 197, 210, and beyond, as long as it stays above the strong support level around 162.
- In the coming weeks, investors can consider buying the stock at dips towards 178 and 170, with the expectation of holding for potential higher gains in the following months.
Open Interest Study
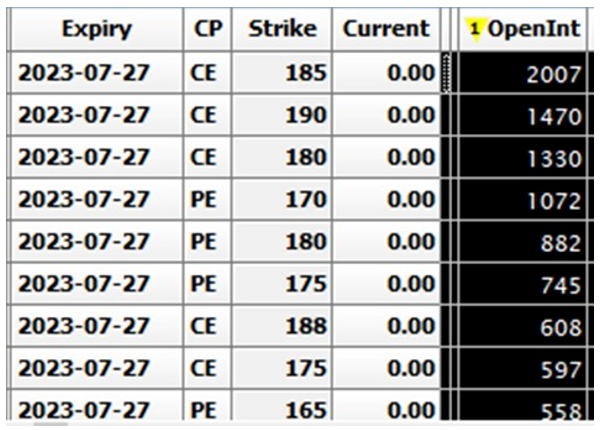
- Based on the July Open Interest Chain data, Ashok Leyland has a significant build-up of Call options (CE) at strike prices of around 180 and 190, and Put options (PE) have the most build-up at strike prices of 170 and 180.
- This data suggests that there is a strong battle between buyers and sellers at the 180 level, which is acting as a major resistance for the stock.
- Looking at the limited data available for August, it seems that the downside is also limited.
- Overall, if Ashok Leyland stays above the 180 level, the weekly bias can be considered as “Range to Up,” meaning there is potential for the stock to move higher within a certain range.
F&O Strategy
| Scrip | ASHOKLEY LTP 181.9 |
| Risk | Moderate |
| Ratio | 1:1 |
| Bias | Range to positive |
| Max Reward Expected | ₹50,000 |
| Max Risk Expected | ₹30,000 |
| Action | Scrip | Lot Size | IP | LTP |
| BUY | ASHOKLEY AUG 180 CE | 5000 | 9.4 | 9.4 |
| SELL | ASHOKLEY AUG 196 CE | 5000 | 3.4 | 3.4 |
|
2. State Bank of India
| Counter | SBIN LTP 614.95 |
| Call | Buy on dip |
| Target 1 | 640 |
| Target 2 | 680 |
| Stop Loss | 585/555 |
| Time Horizon | 3-4 weeks |
| Notes | Buy-On-Dip towards 610 & 595 |
State Bank of India (SBI) a Fortune 500 company, is an Indian Multinational, Public Sector Banking and Financial services statutory body headquartered in Mumbai. The rich heritage and legacy of over 200 years, accredits SBI as the most trusted Bank by Indians through generations.
SBI, the largest Indian Bank with 1/4th market share, serves over 48 crore customers through its vast network of over 22,405 branches, 65,627 ATMs/ADWMs, 76,089 BC outlets, with an undeterred focus on innovation, and customer centricity, which stems from the core values of the Bank – Service, Transparency, Ethics, Politeness and Sustainability.
| Previous Close | 610.0 | TTM EPS | 62.4 |
| 52 Week High | 629.6 | TTM PE | 9.9 |
| 52 Week Low | 430.7 | P/B | 1.87 |
| Sector PE | 10.5 | Mkt Cap (Rs. Cr.) | 5,48,952 |
(Source: Moneycontrol, BSE, Fisdom Research)
Technical Outlook
(Source: Fisdom Research)
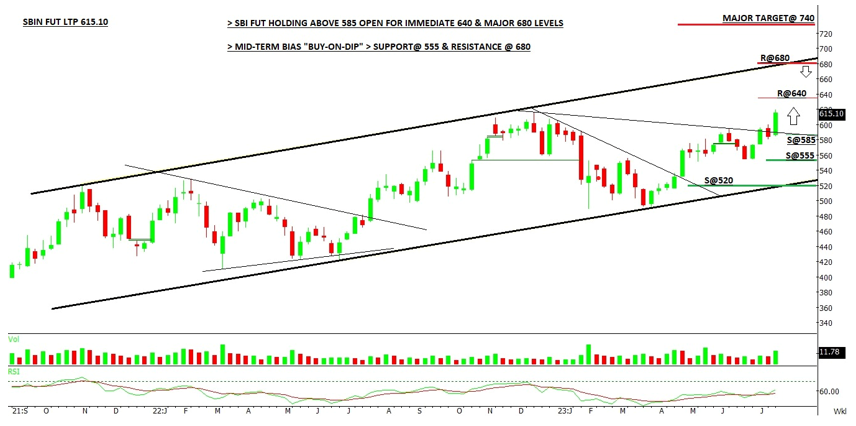
- The overall outlook for SBI is bullish, provided it stays above the immediate support levels of 555 and 480. In this case, the potential targets on the higher end are 680 and 740.
- In the short to mid-term, SBI is considered a “Buy-On-Dip” stock, as it ended the previous week on a strong note, indicating the possibility of a fresh upward movement.
- According to price analysis, if SBI remains above the immediate support zone of 585-580, it is expected to continue its “Buy-On-Dip” trend, with an immediate target and resistance at 640 levels, followed by 680 in the coming months.
Open Interest
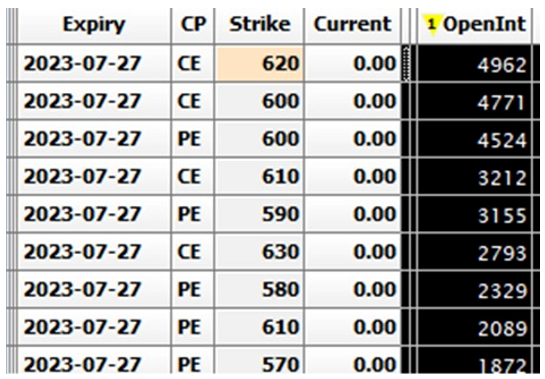
- Based on the Option Chain Data for the July Series, SBI is experiencing a significant “Tug-Of-War” at around 620 levels.
- There is a high build-up of Call options (CE) at the 620 strike price and a significant build-up of Put options (PE) at the 600 and 590 strike prices.
- The data suggests that if the stock dips towards 610 or 600, it may present a good risk-reward opportunity for traders to consider long hedged positions, as there is substantial open interest at higher strike prices.
F&O Strategy
| Scrip | SBIN LTP 262.15 |
| Risk | Moderate |
| Ratio | 1:1 |
| Bias | Range to positive |
| Max Reward Expected | ₹47,700 |
| Max Risk Expected | ₹27,300 |
| Action | Scrip | QTY | IP | LTP |
| BUY | SBIN AUG 610 CE | 1500 | 25.4 | 25.4 |
| SELL | SBIN AUG 660 CE | 1500 | 7.2 | 7.2 |
|
Disclaimer: This document is not intended for anyone other than the recipient. The contents of this document may not be reproduced or further distributed to any person or entity, whether in whole or in part, for any purpose. If you have received the publication in error please notify the sender immediately. If you are not the named addressee, you should not disseminate, distribute or copy this document. You are hereby notified that disclosing, copying, distributing or taking any action in reliance on the contents of this information is strictly prohibited. All non-authorised reproduction or use of this document will be the responsibility of the user and may lead to legal proceedings. This document has no contractual value and is not and should not be construed as advice or as an offer or the solicitation of an offer or a recommendation to take action in consonance in any jurisdiction. Finwizard Technology Private Limited (“Fisdom”) makes no guarantee, representation or warranty and accepts no responsibility or liability for the accuracy or completeness of the information and/or opinions contained in this document, including any third party information obtained from sources it believes to be reliable but which has not been independently verified. In no event will Fisdom be liable for any damages, losses or liabilities including without limitation, direct or indirect, special, incidental, consequential damages, losses or liabilities, in connection with your use of this document or your reliance on or use or inability to use the information contained in this document, even if you advise us of the possibility of such damages, losses or expenses. Fisdom does not undertake any obligation to issue any further publications or update the contents of this document. The information stated and/or opinion(s) expressed herein are expressed solely as general commentary for general information purposes only and do not constitute advice, solicitation or recommendation to act upon thereof. Fisdom does not have regard to specific investment objectives, financial situation and the particular needs of any specific person who may receive this document. The information contained within this document has not been reviewed in the light of your personal circumstances. Please note that this information is neither intended to aid in decision making for legal, financial or other consulting questions, nor should it be the basis of any investment or other decisions. Fisdom may have issued other similar documents that are inconsistent with and reach different conclusion from the information presented in this document. The relevant offering documents should be read for further details. You should make such researches/inspections/inquiries as it deems necessary to arrive at an independent evaluation of companies referred to in this document (including the merits and risks involved), and should consult its own advisors to determine the merits and risks involved. Fisdom makes no representations that the offerings mentioned in this document are available to persons of any other country or are necessarily suitable for any particular person or appropriate in accordance with their local law. Among other things, this means that the disclosures set forth in this document may not conform to rules of the regulatory bodies of any other country and investment in the offer discussed will not afford the protection offered by the local regulatory regime in any other country. Past performance contained in this document is not a reliable indicator of future performance whilst any forecasts, projections and simulations contained herein should not be relied upon as an indication of future results. The historical performance presented in this document is not indicative of and should not be construed as being indicative of or otherwise used as a proxy for future or specific investments. The relevant product documents should be read for further details. Fisdom does not undertake any obligation to issue any further publications to you or update the contents of this document and such contents are subject to changes at anytime.