Technical Overview – Nifty 50
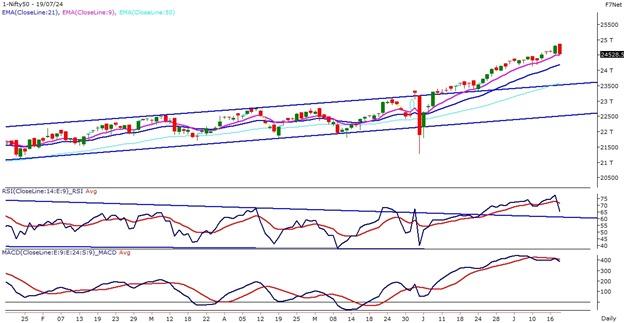
The index reached a new all-time high, but it didn’t last long and had a notable intraday 1.3% decline from the highs. Midcap and Small cap had intraday declines of about 2%, indicating continued pressure. On a weekly timeframe, the benchmark index created a SHOOTING STAR candlestick formation on the weekly chart and a BEARISH ENGULFING candlestick formation on the daily chart.
At all-time high levels, the momentum indicator, RSI (14) exhibits a bearish divergence on a weekly timeframe. The weekly timeframe shows that the index is trading above the main EMA, and in the upcoming weeks, we may expect a mean reversion of the index to the 10 and 20 EMAs. If there is a mean reversion, the buying-on-dips strategy is still in place.
The percentage of equities with RSI=>50 in the benchmark indexes dropped significantly from 90% to 72%. Based on benchmark index OI data, a base formation may take place at the 24,300 level, where put writing is almost 30 lakhs. At 24,700, call writing is almost close to 43 lakhs, which might act as a resistance. The PCR value of the benchmark index is 0.96.
The support and resistance levels for the next sessions are at 24,450 and 24,350 and 24,650 and 24,750, respectively..
Technical Overview – Bank Nifty
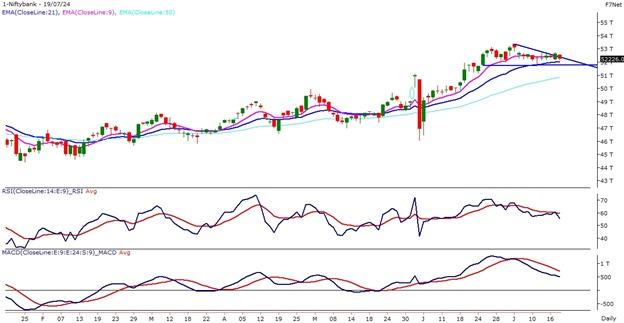
The benchmark index experienced a substantial decrease, whilst the banking index remained in a consolidation zone with no discernible movement. This week banking index didn’t show any notable movement and kept consolidating.
The momentum indicator RSI (14) shows a hidden positive divergence on a daily timeframe, suggesting that the momentum increase is likely to continue. Bulls’ zeal for baking the index appeared to be waning, but the 20-DEMA supported the index over the previous session. Over the daily chart, the MACD displays a negative crossing, indicating a lag in momentum.
Based on benchmark index OI data, a base formation may take place at the 52,000 level, where put writing is close to 10 lakhs. At 52,500, call writing is almost close to 19 lakhs, which might act as a resistance. The PCR value of the benchmark index is 0.63.
In the event of a decline, the opinion is still to buy on dips and to pyramid over 52,800 levels. The resistance and support levels for the upcoming sessions are 52,650, 52,850 for resistance, and 52,000, 51,750 for support.
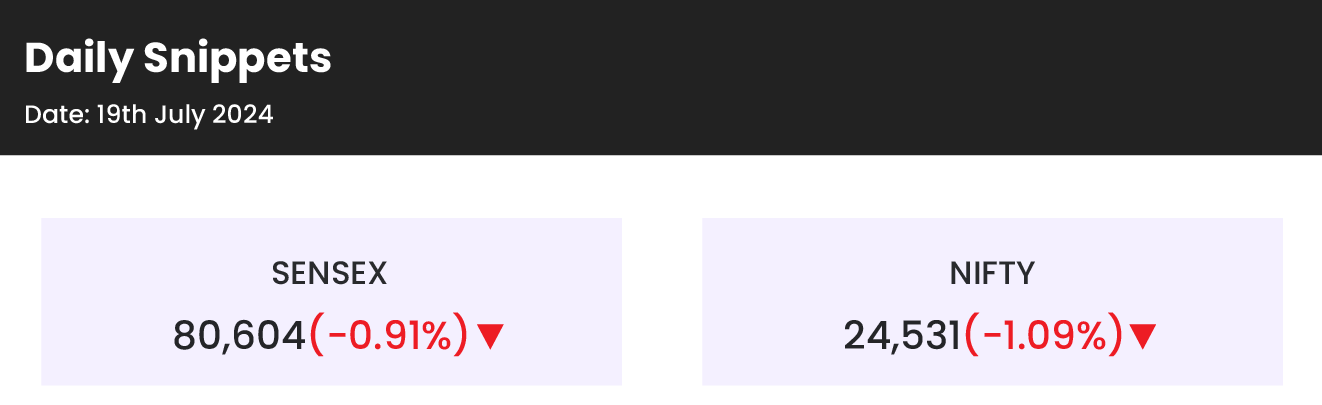
Indian markets:
- Indian shares traded lower on Friday due to weak global market cues and fears of new U.S.-China trade tensions.
- Despite opening at record highs, the Nifty 50 and Sensex quickly slipped into the red and fell sharply later in the session.
- India’s benchmark stock indices ended their rally, hitting downward trends after reaching fresh record highs for the fourth consecutive session on Friday.
- Sectors such as Metal, Auto, Financial Services, and Energy saw significant declines.
- Brokerage stocks fell as a Microsoft outage impacted operations.
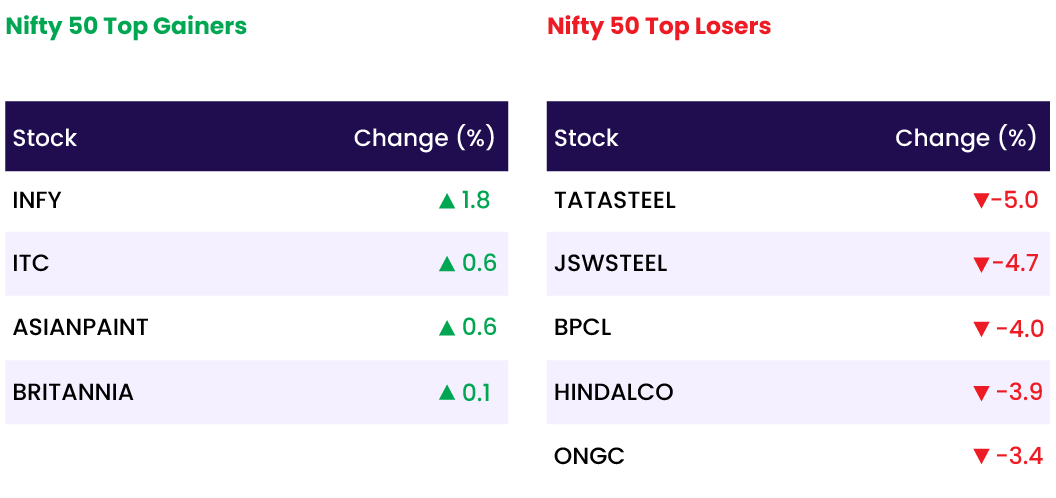
- Infosys shares rose after posting better-than-expected Q1 FY25 results and raising its FY25 revenue growth forecast to 3-4%.
- Other top gainers included Asian Paints, LTIMindtree, and Titan Company.
- In contrast, Persistent Systems fell nearly 7% after its Q1 profit missed estimates..
Global Markets:
- World stocks retreated from record highs on Friday.
- Investors rotated away from megacap growth stocks.
- A global cyber outage impacted services across airlines, banks, and financial services.
- This capped a turbulent week for markets.
- The tech sell-off was triggered by Sino-U.S. trade tensions.
- Doubts over U.S. President Joe Biden’s presidential race prospects contributed to the sell-off.
- Growing chances of a win for rival Donald Trump also affected market sentiment.
- Weak Chinese economic data and a lacklustre third plenum outcome added to the negative global mood.
Stocks in Spotlight
- Wipro Ltd reported a 4.6 percent year-on-year increase in its Q1 FY25 net profit, reaching Rs 3,003 crore, surpassing market expectations. However, the IT company’s consolidated revenue for April-June fell by 3.8 percent to Rs 21,964 crore. Wipro has forecasted sequential revenue growth in the range of -1 percent to 1 percent in constant currency terms, following a reduction in guidance last quarter to -1.5 percent to 0.5 percent.
- JSW Steel’s Q1 FY25 net profit attributable to owners fell 64 percent to Rs 867 crore, despite lower raw material costs, due to weaker export market realisation and strong competition from Chinese steel. The company’s revenue increased to Rs 42,943 crore, up from Rs 42,213 crore in the same quarter last year, according to a regulatory filing on July 19.
- Infosys surged 5 percent in early trade on July 19, hitting a 52-week high after exceeding Q1 earnings expectations and raising revenue growth guidance, indicating signs of recovery. Revenue from operations increased 3.7 percent quarter-on-quarter to Rs 39,315 crore, while consolidated net profit fell around 20 percent sequentially to Rs 6,368 crore due to a high base from a previous tax refund. Both revenue and profit surpassed market estimates.
News from the IPO world🌐
- Sahaj Solar makes bumper debut
- Swiggy announces $65 million ESOP programme for employees ahead of IPO
- Insurer Niva Bupa plans $360 million IPO.
Daily Leader board:
Sectoral Performance
| Top Sectors | Day change (%) |
| NIFTY FMCG | -0.2 |
| NIFTY IT | -0.2 |
| NIFTY BANK | -0.7 |
| NIFTY FINANCIAL SERVICES | -0.8 |
| NIFTY PRIVATE BANK | -0.9 |
Advance Decline Ratio
| Advance/Declines | Day change (%) |
| Advances | 1424 |
| Decline | 2500 |
| Unchanged | 92 |
Numbers to track
| Indices Name | Latest | % 1D | % YTD |
| Dow Jones (US) | 40,665 | 1.3 % | 8.8 % |
| 10 Year Gsec India | 7.0 | (0.0) % | 0.9 % |
| WTI Crude (USD/bbl) | 81 | (0.4) % | 14.3 % |
| Gold (INR/10g) | 73,222 | (1.0) % | 7.6 % |
| USD/INR | 83.58 | 0.0 % | 0.6 % |
Please visit www.fisdom.com for a standard disclaimer