Eveready Industries India Ltd is a prominent player in the dry cell batteries segment. In addition to batteries, the company produces flashlights (torches), mosquito repellents, and packaged tea. Looking to expand its product portfolio, Eveready Industries is currently test marketing a dishwashing detergent, with plans to launch the product upon successful completion of the trials.
Previous Close
414.30
TTM EPS
9.80
52 Week High
463.00
TTM PE
45.15
52 Week Low
295.05
P/B
8.32
Sector PE
34.87
Mkt Cap (Rs. Cr.)
3,216
(Source: Moneycontrol, BSE, Fisdom Research)
Technical Outlook
(Source: Fisdom research)
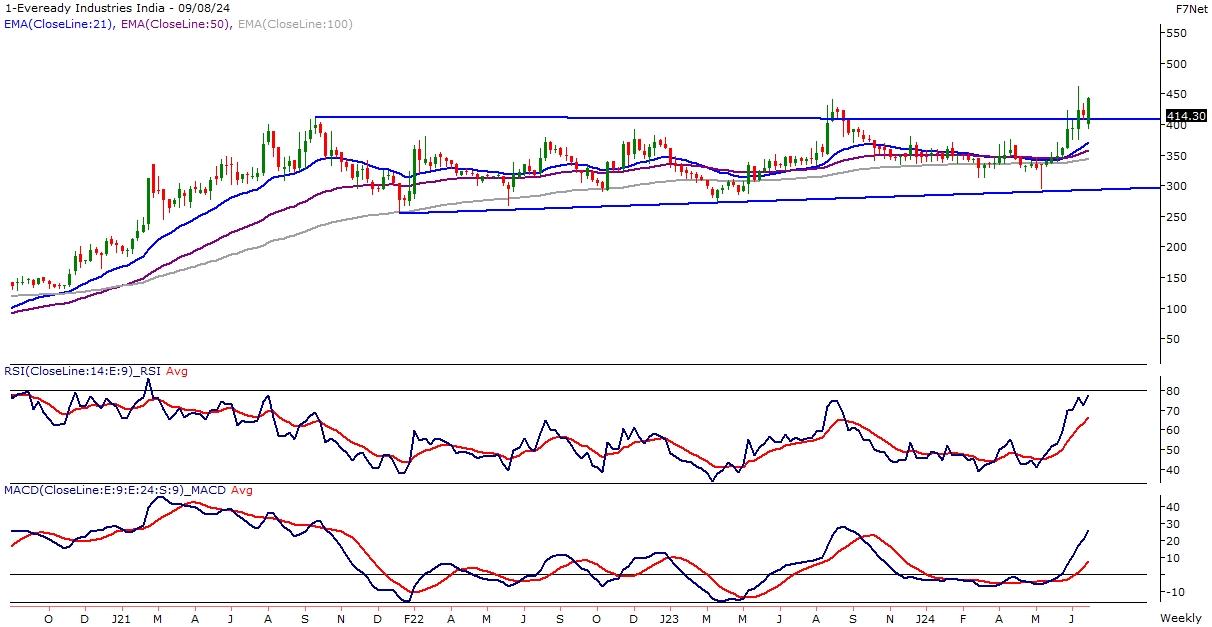
EVEREADY has given a rectangle pattern breakout on the weekly chart, coming out of a 3-year consolidation. The stock has been in Higher-Low formation and has been in bullish momentum past 9 weeks.
Stock has shown high volumes at breakout indicating a confirmed breakout.
Momentum Indicator RSI (14) has formed a rounding pattern formation and is trading above 55 levels indicating an overall bullish momentum to continue in coming sessions.
Stock has been trading above major EMA on the weekly chart maintaining the bullish momentum.
MACD has given a positive crossover indicating a shift in momentum to positive.
Supriya Lifescience Ltd is a manufacturer of Active Pharmaceutical Ingredients (APIs), focusing on a wide range of therapeutic segments, including antihistamines, analgesics, anesthetics, vitamins, anti-asthmatics, and anti-allergic medications.
Previous Close
428.55
TTM EPS
14.80
52 Week High
454.00
TTM PE
30.40
52 Week Low
234.90
P/B
4.45
Sector PE
46.93
Mkt Cap (Rs. Cr.)
3,620
(Source: Moneycontrol, BSE, Fisdom Research)
Technical Outlook
(Source: Fisdom research)
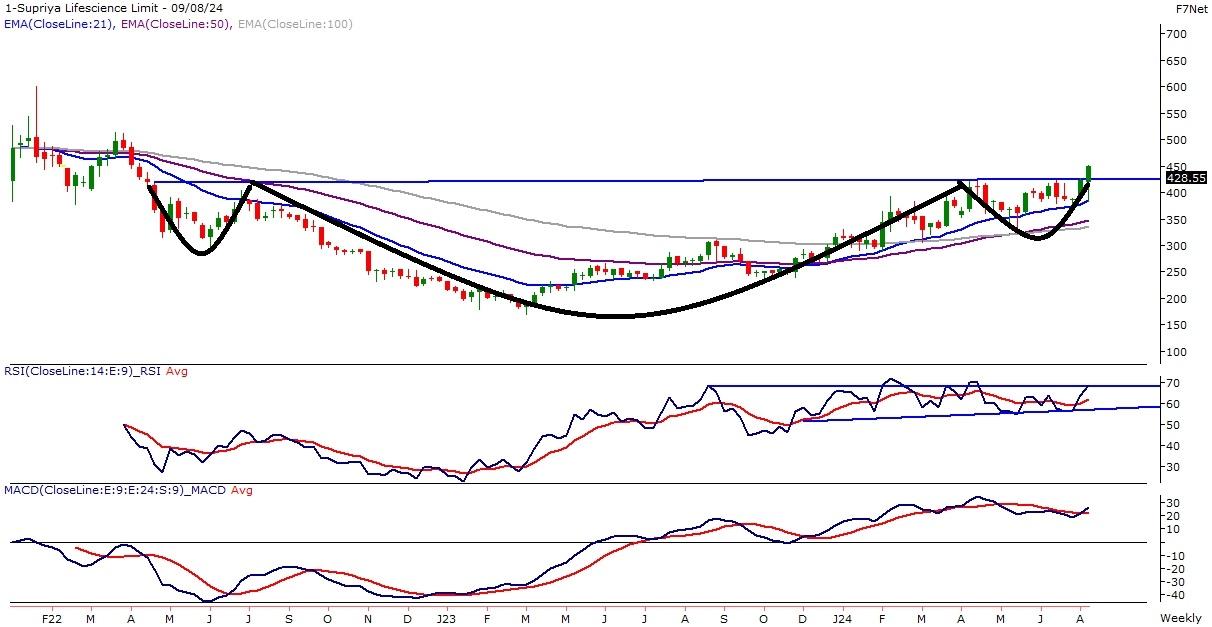
SUPRIYA LIFESCIENCE has given an Inverted Head and Shoulders pattern breakout on the weekly chart closing above the neckline on weekly chart.
Stock has been in a higher–low formation continuing the overall bullish move.
Momentum indicator RSI (14) has a bullish range shift, where base/support has been formed at the 55 mark.
10 and 20 EMA have been acting as a good support zone and stock is trading above major EMA, giving a positive outlook.
MACD has been above polarity and overall positive.0
Disclaimer: This document is not intended for anyone other than the recipient. The contents of this document may not be reproduced or further distributed to any person or entity, whether in whole or in part, for any purpose. If you have received the publication in error please notify the sender immediately. If you are not the named addressee, you should not disseminate, distribute or copy this document. You are hereby notified that disclosing, copying, distributing or taking any action in reliance on the contents of this information is strictly prohibited. All non-authorised reproduction or use of this document will be the responsibility of the user and may lead to legal proceedings. This document has no contractual value and is not and should not be construed as advice or as an offer or the solicitation of an offer or a recommendation to take action in consonance in any jurisdiction. Finwizard Technology Private Limited (“Fisdom”) makes no guarantee, representation or warranty and accepts no responsibility or liability for the accuracy or completeness of the information and/or opinions contained in this document, including any third party information obtained from sources it believes to be reliable but which has not been independently verified. In no event will Fisdom be liable for any damages, losses or liabilities including without limitation, direct or indirect, special, incidental, consequential damages, losses or liabilities, in connection with your use of this document or your reliance on or use or inability to use the information contained in this document, even if you advise us of the possibility of such damages, losses or expenses. Fisdom does not undertake any obligation to issue any further publications or update the contents of this document. The information stated and/or opinion(s) expressed herein are expressed solely as general commentary for general information purposes only and do not constitute advice, solicitation or recommendation to act upon thereof. Fisdom does not have regard to specific investment objectives, financial situation and the particular needs of any specific person who may receive this document. The information contained within this document has not been reviewed in the light of your personal circumstances. Please note that this information is neither intended to aid in decision making for legal, financial or other consulting questions, nor should it be the basis of any investment or other decisions. Fisdom may have issued other similar documents that are inconsistent with and reach different conclusion from the information presented in this document. The relevant offering documents should be read for further details. You should make such researches/inspections/inquiries as it deems necessary to arrive at an independent evaluation of companies referred to in this document (including the merits and risks involved), and should consult its own advisors to determine the merits and risks involved. Fisdom makes no representations that the offerings mentioned in this document are available to persons of any other country or are necessarily suitable for any particular person or appropriate in accordance with their local law. Among other things, this means that the disclosures set forth in this document may not conform to rules of the regulatory bodies of any other country and investment in the offer discussed will not afford the protection offered by the local regulatory regime in any other country. Past performance contained in this document is not a reliable indicator of future performance whilst any forecasts, projections and simulations contained herein should not be relied upon as an indication of future results. The historical performance presented in this document is not indicative of and should not be construed as being indicative of or otherwise used as a proxy for future or specific investments. The relevant product documents should be read for further details. Fisdom does not undertake any obligation to issue any further publications to you or update the contents of this document and such contents are subject to changes at anytime.
Share the article
Array
Get exclusive content
and expert advice
Subscribe to fisdom to get regular updates in the finance world delivered to your inbox each month