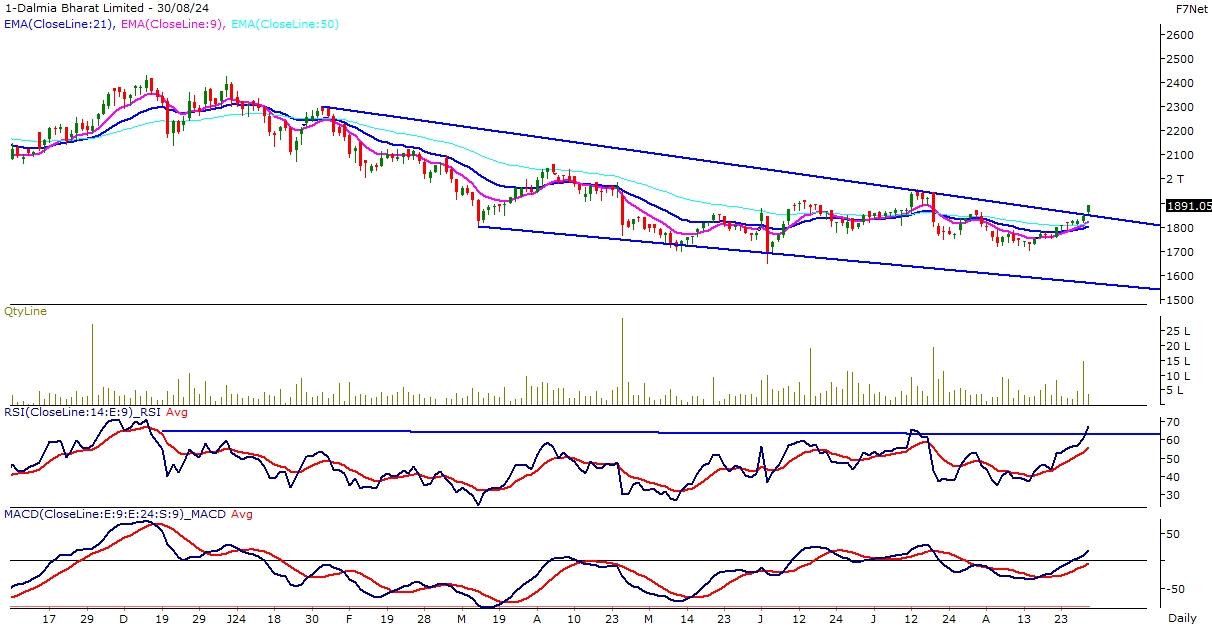
DALMIA BHARAT has given a Falling Channel breakout, closing above the 1-month consolidation zone.
Stock has shown high volumes at breakout indicating a confirmed breakout.
Momentum Indicator RSI (14) has given a rounding bottom pattern breakout and moved above the 65 mark indicating an overall bullish momentum to continue in coming sessions.
Stock has been trading above major EMA on the weekly chart maintaining the bullish momentum.
MACD has given a positive crossover indicating a shift in momentum to positive.
Safari is in the business of manufacturing and trading of luggage and luggage accessories. There are two broad categories of luggage i.e hard luggage and soft luggage. Hard luggages are mainly made of Poly Propylene (PP) and Poly Carbonate (PC) and manufactured in-house by Safari at its Plant located at Halol, Gujarat. Soft luggages are made of fabrics of various kinds and are mainly imported by Safari.
Previous Close
2,351.45
TTM EPS
34.85
52 Week High
2,524.00
TTM PE
71.05
52 Week Low
1,648.60
P/B
14.70
Sector PE
35.75
Mkt Cap (Rs. Cr.)
12,098
(Source: Moneycontrol, BSE, Fisdom Research)
Technical Outlook
(Source: Fisdom research)
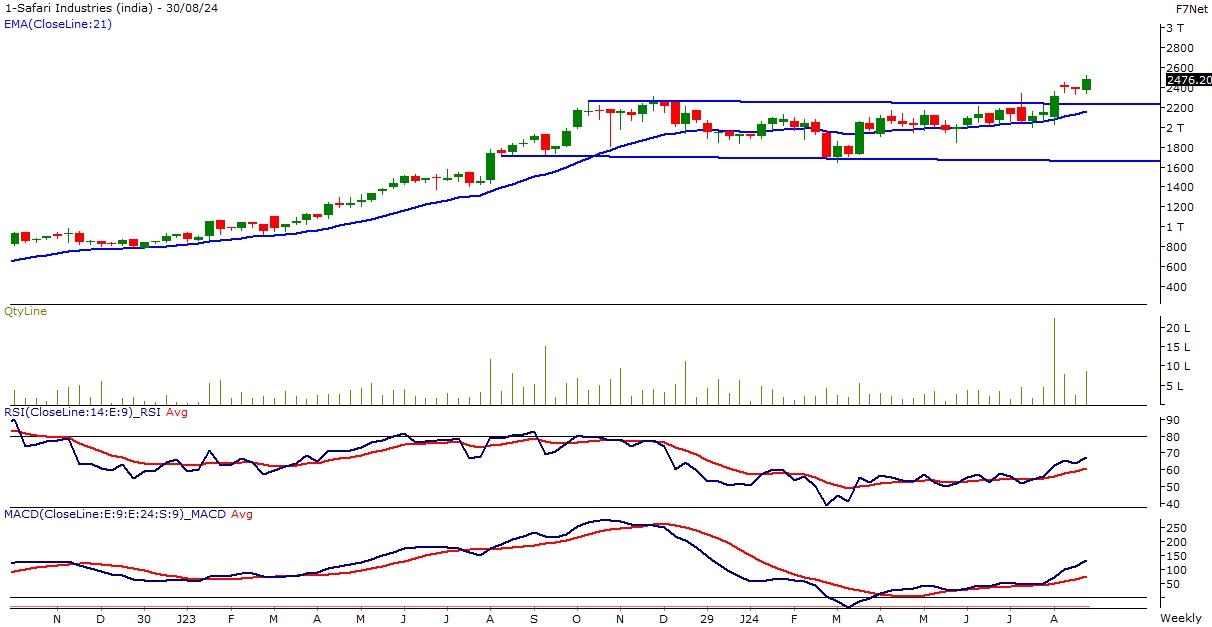
SAFARI has given a rectangle pattern breakout and sustained above the 2,450 level with higher relative volumes.
Momentum indicator RSI (14) has retested the falling trendline breakout making a base near the 60 mark.
Stock has been trading above major EMA on the weekly chart maintaining the bullish momentum. 10 EMA has been supporting the daily chart.
MACD has given a positive crossover indicating a shift in momentum to positive.
Disclaimer: This document is not intended for anyone other than the recipient. The contents of this document may not be reproduced or further distributed to any person or entity, whether in whole or in part, for any purpose. If you have received the publication in error please notify the sender immediately. If you are not the named addressee, you should not disseminate, distribute or copy this document. You are hereby notified that disclosing, copying, distributing or taking any action in reliance on the contents of this information is strictly prohibited. All non-authorised reproduction or use of this document will be the responsibility of the user and may lead to legal proceedings. This document has no contractual value and is not and should not be construed as advice or as an offer or the solicitation of an offer or a recommendation to take action in consonance in any jurisdiction. Finwizard Technology Private Limited (“Fisdom”) makes no guarantee, representation or warranty and accepts no responsibility or liability for the accuracy or completeness of the information and/or opinions contained in this document, including any third party information obtained from sources it believes to be reliable but which has not been independently verified. In no event will Fisdom be liable for any damages, losses or liabilities including without limitation, direct or indirect, special, incidental, consequential damages, losses or liabilities, in connection with your use of this document or your reliance on or use or inability to use the information contained in this document, even if you advise us of the possibility of such damages, losses or expenses. Fisdom does not undertake any obligation to issue any further publications or update the contents of this document. The information stated and/or opinion(s) expressed herein are expressed solely as general commentary for general information purposes only and do not constitute advice, solicitation or recommendation to act upon thereof. Fisdom does not have regard to specific investment objectives, financial situation and the particular needs of any specific person who may receive this document. The information contained within this document has not been reviewed in the light of your personal circumstances. Please note that this information is neither intended to aid in decision making for legal, financial or other consulting questions, nor should it be the basis of any investment or other decisions. Fisdom may have issued other similar documents that are inconsistent with and reach different conclusion from the information presented in this document. The relevant offering documents should be read for further details. You should make such researches/inspections/inquiries as it deems necessary to arrive at an independent evaluation of companies referred to in this document (including the merits and risks involved), and should consult its own advisors to determine the merits and risks involved. Fisdom makes no representations that the offerings mentioned in this document are available to persons of any other country or are necessarily suitable for any particular person or appropriate in accordance with their local law. Among other things, this means that the disclosures set forth in this document may not conform to rules of the regulatory bodies of any other country and investment in the offer discussed will not afford the protection offered by the local regulatory regime in any other country. Past performance contained in this document is not a reliable indicator of future performance whilst any forecasts, projections and simulations contained herein should not be relied upon as an indication of future results. The historical performance presented in this document is not indicative of and should not be construed as being indicative of or otherwise used as a proxy for future or specific investments. The relevant product documents should be read for further details. Fisdom does not undertake any obligation to issue any further publications to you or update the contents of this document and such contents are subject to changes at anytime.
Share the article
Array
Get exclusive content
and expert advice
Subscribe to fisdom to get regular updates in the finance world delivered to your inbox each month