Overview: Contra Funds
In the landscape of mutual fund investing, where strategies and trends intersect, the domain of contra-mutual funds stands out as a thought-provoking phenomenon. Rooted in contrarian principles, these funds challenge the norm by seeking value in challenging areas. Operating with a distinctive methodology that involves investing in stocks undervalued or overlooked by the market, contra mutual funds have created a niche that piques the curiosity of both experienced and novice investors.
This research article delves into the intriguing realm of contra mutual funds, examining their foundational principles, historical performance, the rationale behind their contrarian strategy, and their potential as valuable addition to diverse investment portfolios. Through an in-depth analysis, our objective is to unravel the intricacies of contra mutual funds, casting light on their unique attributes and offering insights to empower investors in navigating the evolving landscape of investment decisions.
Before delving into the intricate aspects of this category, let’s begin by grasping the essence of the contra strategy:
- Stocks exhibiting contrarian tendencies.
- Companies undergoing a turnaround phase and trading below their intrinsic value.
- Growth-oriented enterprises offering appealing valuations.
- Investing in stocks regardless of market capitalisation
- Engaging in active overweight and underweights compared to the benchmark.
Category Landscape
According to SEBI, contra funds should follow a contrarian investment strategy and have a minimum equity investment in equity of about 65%. Let’s have a look at the category growth of contra vs other equity categories:
| Category | AUM_Apr 2019 (In Rs Crores) |
AUM_Jul 2023 (In Rs Crores) |
% of Total AUM | AUM Growth |
| Flexi Cap Fund | — | ₹ 2,80,965 | 15.4% | — |
| Large Cap Fund | ₹ 1,26,596 | ₹ 2,66,035 | 14.6% | 18.8% |
| Mid Cap Fund | ₹ 75,058 | ₹ 2,29,879 | 12.6% | 29.1% |
| Sectoral/Thematic Funds | ₹ 62,082 | ₹ 2,06,710 | 11.3% | 31.8% |
| Small Cap Fund | ₹ 43,872 | ₹ 1,82,493 | 10.0% | 38.5% |
| ELSS | ₹ 92,044 | ₹ 1,76,490 | 9.7% | 16.1% |
| Large & Mid Cap Fund | ₹ 51,427 | ₹ 1,55,885 | 8.5% | 29.0% |
| Focused Fund | ₹ 37,393 | ₹ 1,12,685 | 6.2% | 29.2% |
| Value Fund | ₹ 52,102 | ₹ 84,787 | 4.6% | 11.1% |
| Multi Cap Fund | ₹ 1,52,056 | ₹ 85,031 | 4.7% | — |
| Contra Fund | ₹ 6,094 | ₹ 26,265 | 1.4% | 41.0% |
| Dividend Yield Fund | ₹ 4,826 | ₹ 17,368 | 1.0% | 34.1% |
| Total | ₹ 7,03,550 | ₹ 18,24,594 | 100.0% | 25.1% |
Source: ACEMF, Fisdom Research.
- The size of the contra fund category is currently at about 1.4% of the total equity assets under management (AUM).
- In April 2019, the AUM for contra funds stood at approximately Rs. 6,094 crores. It has experienced a notable growth of 40% since then.
- The overall equity AUM has grown by 25% over the same period, reaching Rs. 18.24 lakh crore as of July 2023.
- This growth trend signifies that contra funds have been growing faster than the broader equity market.
Is Contra True to Label Category?
1. Portfolio Level Price to earnings comparison:
| Month | Contra | Flexi Cap | Focused | Large & Mid Cap | Large Cap | Multi Cap |
| Jul-22 | 31.8 | 36.4 | 36.6 | 37.8 | 34.9 | 36.5 |
| Aug-22 | 32.8 | 38.7 | 38.7 | 39.9 | 36.5 | 38.8 |
| Sep-22 | 32.7 | 38.3 | 37.7 | 40.5 | 34.9 | 38.2 |
| Oct-22 | 33.1 | 38.2 | 38.4 | 40.5 | 35.1 | 38.6 |
| Nov-22 | 32.1 | 37.9 | 38.2 | 39.8 | 35.8 | 37.7 |
| Dec-22 | 30.0 | 36.1 | 36.6 | 38.4 | 33.9 | 36.1 |
| Jan-23 | 28.7 | 34.5 | 33.3 | 35.7 | 32.1 | 34.8 |
| Feb-23 | 28.6 | 34.0 | 33.0 | 35.6 | 31.0 | 34.5 |
| Mar-23 | 27.9 | 33.0 | 32.4 | 33.9 | 29.7 | 32.8 |
| Apr-23 | 28.7 | 34.1 | 33.8 | 35.1 | 30.4 | 33.9 |
| May-23 | 30.9 | 36.2 | 36.3 | 37.4 | 32.2 | 36.5 |
| Jun-23 | 32.7 | 37.4 | 38.2 | 38.2 | 33.1 | 38.8 |
| Jul-23 | 33.6 | 38.2 | 39.3 | 39.6 | 34.3 | 39.6 |
Source: ACE MF, Fisdom Research
2. Portfolio Level Price to book value comparison:
| Month | Contra | Flexi Cap | Focused | Large & Mid Cap | Large Cap | Multi Cap |
| Jul-22 | 4.8 | 6.3 | 5.9 | 6.3 | 5.9 | 6.1 |
| Aug-22 | 5.0 | 6.6 | 6.1 | 6.6 | 6.1 | 6.3 |
| Sep-22 | 5.0 | 6.7 | 6.2 | 6.7 | 6.0 | 6.5 |
| Oct-22 | 5.0 | 6.7 | 6.3 | 6.6 | 6.1 | 6.5 |
| Nov-22 | 4.7 | 6.7 | 6.3 | 6.7 | 6.2 | 6.4 |
| Dec-22 | 4.4 | 6.4 | 6.0 | 6.4 | 5.9 | 6.1 |
| Jan-23 | 4.2 | 5.9 | 5.4 | 5.8 | 5.5 | 5.6 |
| Feb-23 | 4.2 | 5.8 | 5.5 | 5.9 | 5.4 | 5.7 |
| Mar-23 | 4.2 | 5.7 | 5.4 | 5.7 | 5.3 | 5.4 |
| Apr-23 | 4.3 | 5.9 | 5.6 | 5.9 | 5.4 | 5.6 |
| May-23 | 4.6 | 6.3 | 6.1 | 6.4 | 5.8 | 6.0 |
| Jun-23 | 4.6 | 6.3 | 6.1 | 6.3 | 5.7 | 6.0 |
| Jul-23 | 4.8 | 6.4 | 6.1 | 6.4 | 5.9 | 6.2 |
Source: ACE MF, Fisdom Research
Analyst corner:
When we dive into the numbers like the average portfolio Price-to-Earnings (P/E) and Price-to-Book (P/B) ratios and compare them across different fund categories like large-cap, multi-cap, large & mid-cap, focused, and Flexi-cap, we found that the contra category consistently boasts lower ratios, showcasing its unique approach.
Examining data from the past year, this pattern remains unwavering month after month, highlighting that the contra category consistently maintains these lower ratios than its counterparts.
While these numbers provide valuable insight, it’s important to remember that they don’t reveal the whole story. Nonetheless, they unmistakably emphasise the contra funds’ steadfast commitment to their distinct contrarian approach.
3. Contrarian Market Cap Plays
While each fund manager makes active investment decisions, contra-fund managers have shown no hesitation in aggressively pursuing such bets.
Case in point: The Nifty Midcap 150 index displayed minimal movement for nearly a span of two years, spanning from October 2021 to April 2023. Capitalizing on this situation, contra fund managers strategically amassed positions within this timeframe. This deliberate approach resulted in a notable increase in midcap exposure, surging from 14% in 2021 to 23% by 2023.
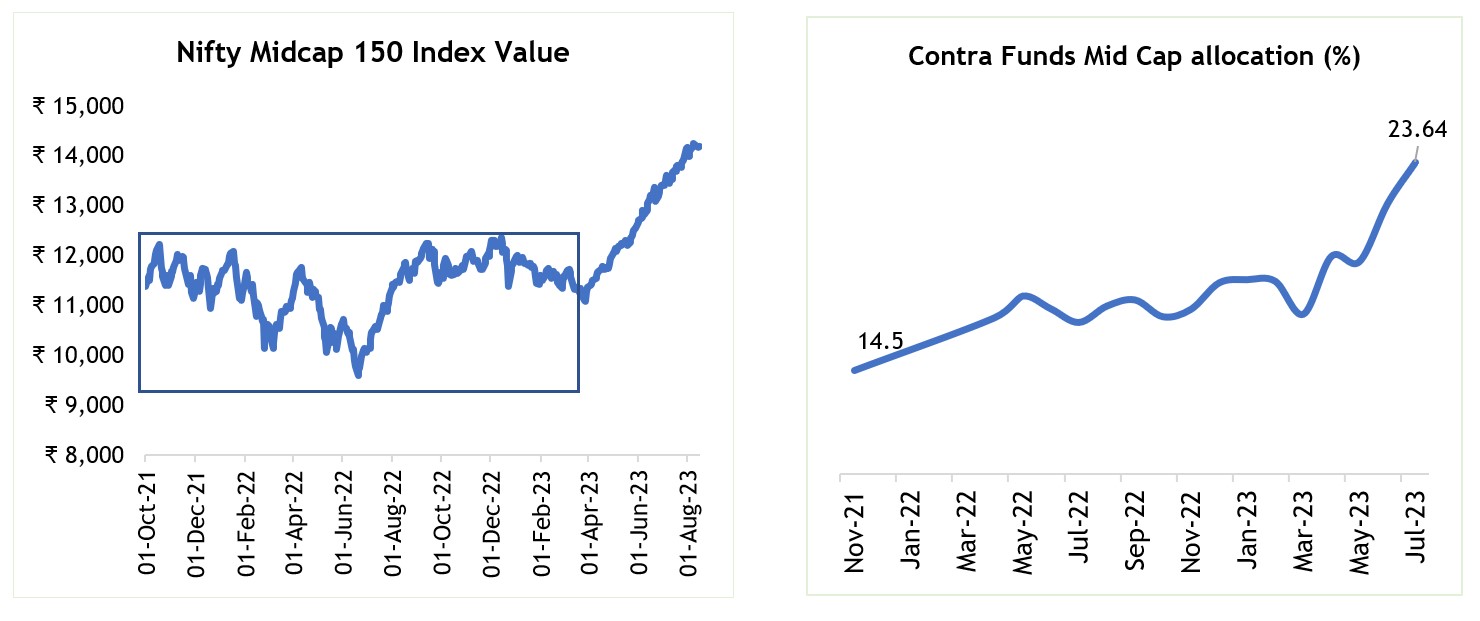
Source: ACE MF, Fisdom Research
These fund managers have seized numerous market capitalization opportunities throughout various market cycles, leading to outstanding returns.
4. Contrarian Sectoral Plays
Alongside their pursuit of contrarian market capitalisation opportunities, contra fund managers have also ventured into making contrarian sectoral bets.