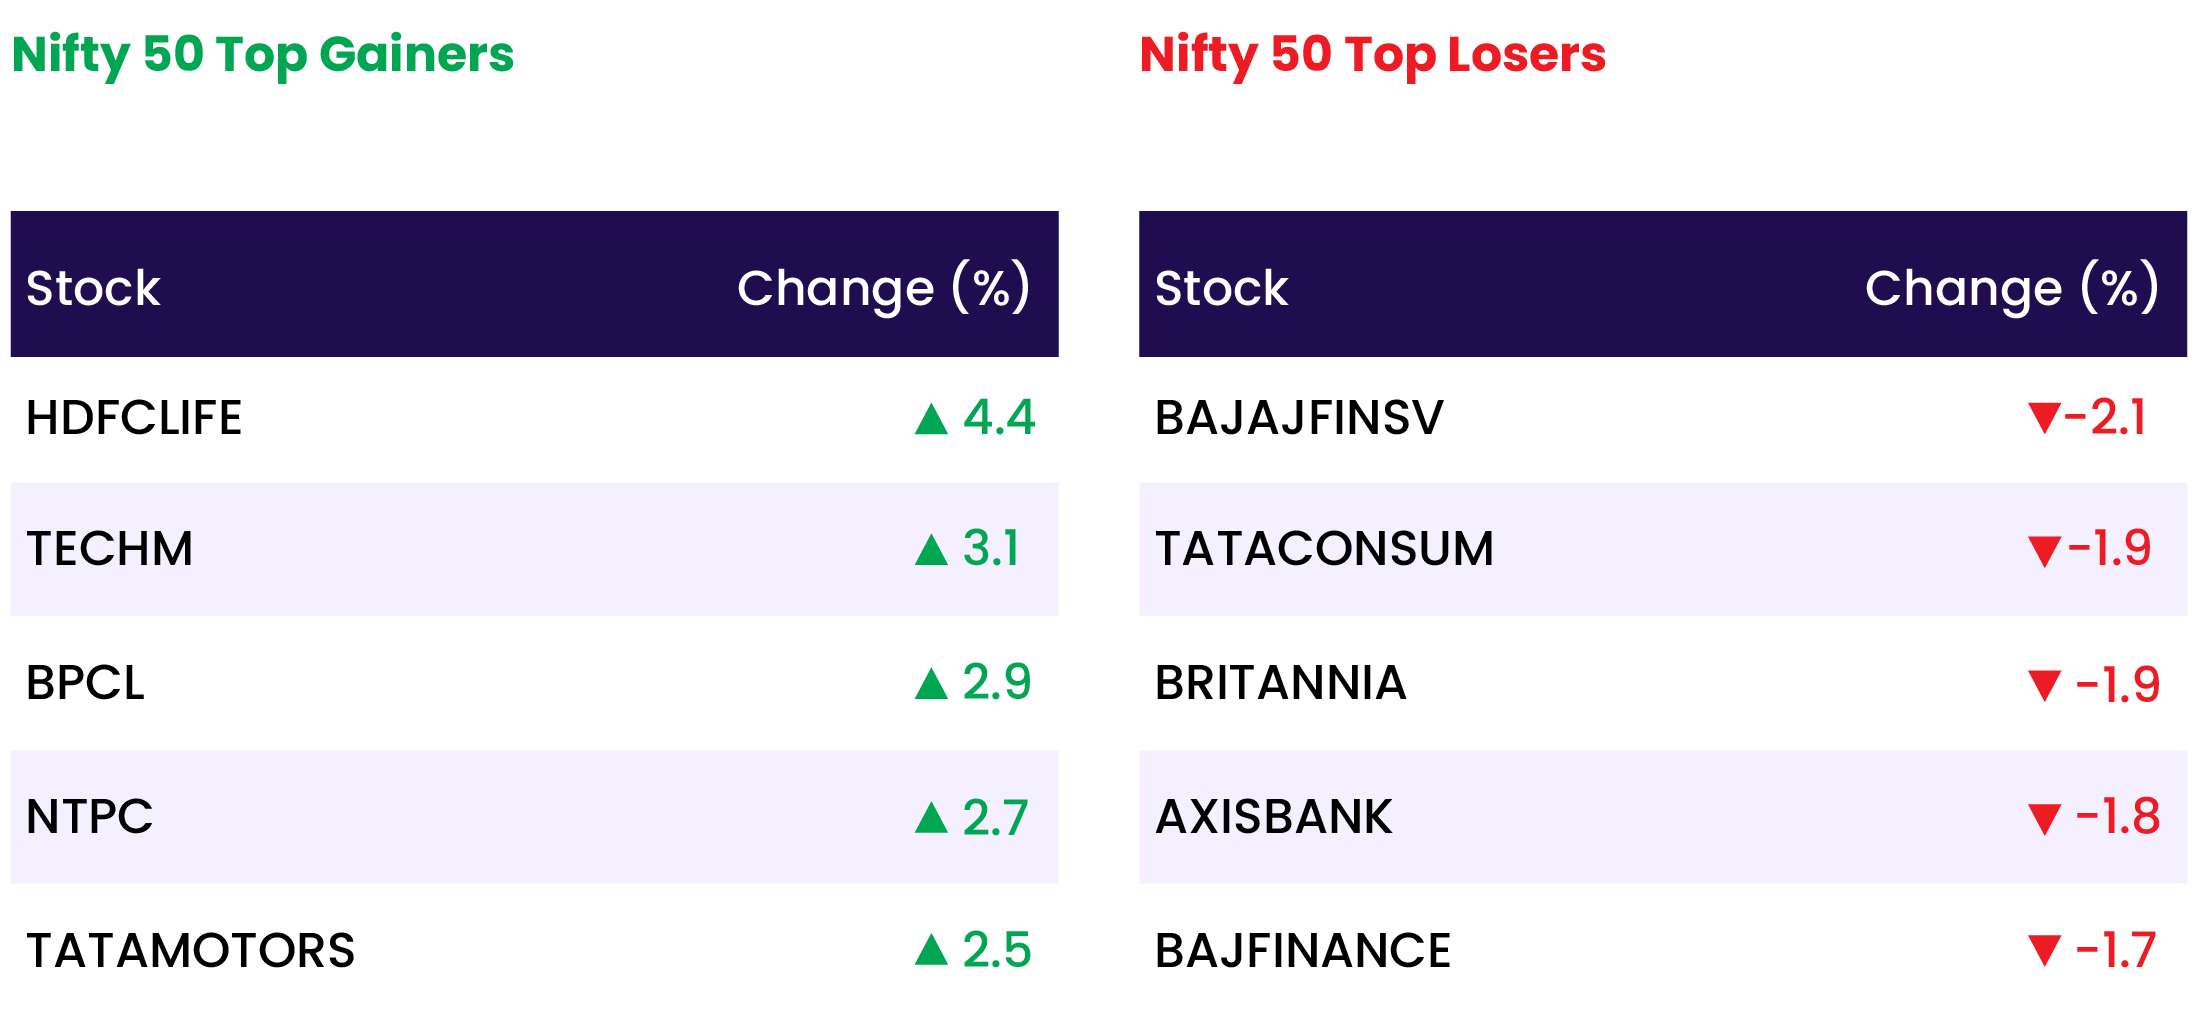

Technical Overview – Nifty 50
The index has been stuck between the 10 and 20 DEMAs and has had difficulty closing above the 10 DEMA for the day. The index was unable to surpass its peak from yesterday. The rising trend line breakdown in the index indicates that overall momentum is now lagging behind bullish momentum.
A higher low is developing for the benchmark index. The momentum indicator, RSI (14) being above 55 levels with hidden bullish divergence, indicates that the upward momentum is still ongoing. The index is still moving higher than the key EMA on the weekly and daily charts, indicating that the positive momentum is still present. A lag in the upward momentum is indicated by the bearish crossover of the MACD.
Based on benchmark index OI data, a base formation may take place at the 24,200 level, where put writing is almost 41 lakhs. At 24,500, call writing is almost close to 92 lakhs, might act as a resistance. The PCR value of the benchmark index is 0.73.
The view remains buy on dips. The support levels for the upcoming sessions are at 24,250 and 24,150 and resistance at 24,600 and 24,700, respectively.
Technical Overview – Bank Nifty
On the daily chart, the Banking Index showed a breakdown of consolidation and closed below the consolidation zone. The index had an erratic day’s session and maintained its gloomy outlook. The index held steady at 50,750, but there doesn’t seem to be any upward momentum.
The rising trend line on the daily chart was broken by the RSI (14) momentum indicator, which also dropped below the 45 level. The index found support at the 10 and 20 DEMAs, and it closed below both of them, suggesting a lack of upward momentum and a bearish hold on the banking index. Even though the index finds support near the 50 DEMA on the daily chart, it is still recommended to buy on dips. The MACD shows a negative crossover over the daily chart, suggesting that the upward trend is lagging.
Based on benchmark index OI data, a base formation may take place at the 51,000 level, where put writing is close to 19 lakhs. At 51,500, call writing is almost close to 12 lakhs, might act as a resistance. The PCR value of the benchmark index is 0.72.
The resistance and support levels for the upcoming sessions are 51,650, 52,100 for resistance, and 50,800, 50,500 for support.
Indian markets:
- On July 24, Indian benchmark indices experienced profit booking for the fourth consecutive session, with the Nifty falling below 24,450, primarily driven by declines in banking stocks.
- Despite weak global cues, the Indian indices opened higher but turned lower within the first hour, extending losses throughout the day. However, last-hour buying helped recover some of the intraday losses.
- Sector-wise, healthcare, oil & gas, media, telecom, and power sectors gained 1-2 percent, while FMCG and banking indices declined by 0.5-1 percent.
- The BSE Midcap index increased by 0.7 percent, and the Smallcap index rose by 2 percent.
Global Markets:
- Asia-Pacific markets declined on Wednesday as traders evaluated July business activity data from Japan and Australia, along with U.S. tech earnings.
- Tech and EV stocks in the region slumped after U.S. giants Alphabet and Tesla reported their second-quarter earnings, with Tesla missing expectations.
- Hong Kong’s Hang Seng index fell 1.1% in the final hour, reversing earlier gains, while mainland China’s CSI 300 slipped 0.63% to a two-week low.
- Japan’s Nikkei 225 fell 1.11% to a one-month low.
- South Korea’s Kospi was down 0.56% at 2,758.71, while the Kosdaq rose 0.26%, the only major Asian benchmark in positive territory.
- Australia’s S&P/ASX 200 remained nearly unchanged at 7,963.7.
Stocks in Spotlight
- United Spirits Shares soared 6.5 percent to hit a record high of Rs 1,417.30, following the company’s positive earnings report for the April-June period.
- Bajel Projects Shares soared up to 9.7 percent after the company announced securing an order worth Rs 586.28 crore from Power Grid.
- Bajaj Finance Shares fell over 2 percent after the company missed Q1 FY25 earnings estimates. Its net interest margin (NIM) declined both sequentially and annually, with analysts also noting potential pressure on NIM for Q2 FY25.
News from the IPO world🌐
- Stallion India Fluorochemicals gets Sebi’s approval to float IPO
- Sebi ready with speed gun on IPO Street
- Insurer Niva Bupa plans $360 million IPO.
Daily Leader board:

Sectoral Performance
| Top Sectors | Day change (%) |
| NIFTY MEDIA | 2.5 |
| NIFTY OIL & GAS | 1.7 |
| NIFTY CONSUMER DURABLES | 1.1 |
| NIFTY MIDSMALL HEALTHCARE | 0.9 |
| NIFTY REALTY | 0.8 |
Advance Decline Ratio
| Advance/Declines | Day change (%) |
| Advances | 2802 |
| Decline | 1094 |
| Unchanged | 112 |
Numbers to track
| Indices Name | Latest | % 1D | % YTD |
| Dow Jones (US) | 40,358 | (0.1) % | 7.0 % |
| 10 Year Gsec India | 7.1 | 1.7 % | 2.5 % |
| WTI Crude (USD/bbl) | 77 | (1.8) % | 9.3 % |
| Gold (INR/10g) | 68,900 | 0.4% | 3.2 % |
| USD/INR | 83.67 | (0.1) % | 0.8 % |


