|
||||||||||||||||||||||||||
| ||||||||||||||||||||||||||
Technical Overview – Nifty 50 | ||||||||||||||||||||||||||
| ||||||||||||||||||||||||||
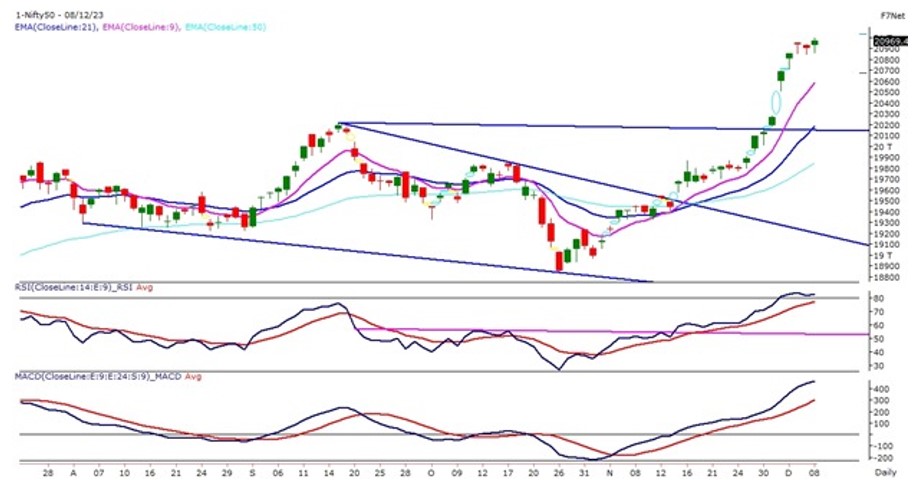
It was a historic day for the Indian Markets where the benchmark Index Nifty50 registered its lifetime high and touched the 21 thousand levels for the very first time. Overall, it was a sideways trading session initially with above-average volatility but later on in the last hour of trading prices moved higher formed another bullish candle stick. On the weekly chart, the Nifty50 has formed a continuation gap and prices have closed in the green for the consecutive 6th week. The prices have given a horizontal trend line breakout and the Index has gained more than 3% return in the week. The view remains to buy on dips for the index towards 20,900 – 20,850 levels and the upside can be extended to 21,100 levels. | ||||||||||||||||||||||||||
Technical Overview – Bank Nifty | ||||||||||||||||||||||||||
| ||||||||||||||||||||||||||
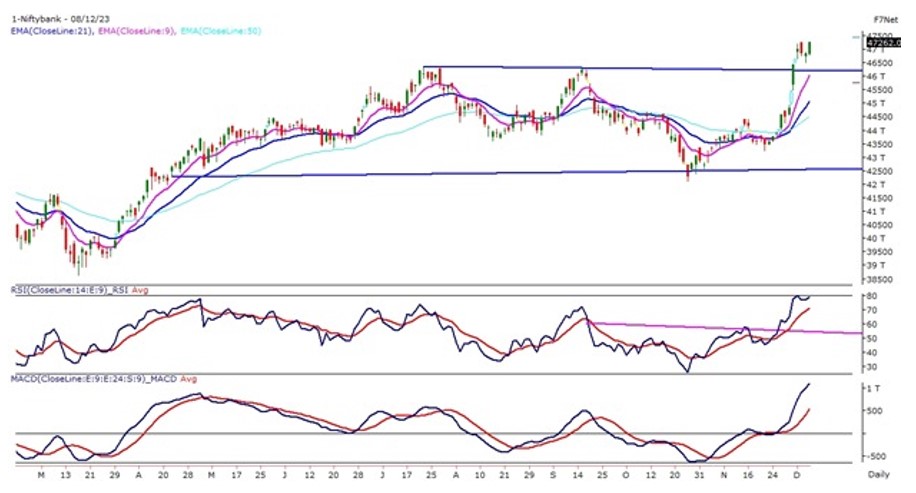
It was a sparkling week for the Banking Index where prices gained 5.50% in a week and formed a tall bullish candle with an unfilled continuation gap on the weekly time frame. The Index on the weekly chart has given a horizontal trend line breakout and prices have closed above the resistance band of the range. The Bank Nifty on the daily chart has witnessed a rectangle pattern breakout and the index has most likely completed the throwback of the pattern. Presently the Index is trading comfortably above its short and medium-term averages on the daily time frame, which is a positive sign for the index. The Bank Nifty on the 60 mins chart has given a bullish flag pattern breakout and the index has closed above the same. The immediate support for the Banking Index has shifted higher near 46,750 levels as prices have witnessed a range breakout and the immediate resistance is likely to be capped below 48,000 levels. | ||||||||||||||||||||||||||
Indian markets:
| ||||||||||||||||||||||||||
Global Markets
| ||||||||||||||||||||||||||
Stocks in Spotlight
| ||||||||||||||||||||||||||
News from the IPO world🌐
| ||||||||||||||||||||||||||
|
Day Leader Board
| ||||||||||||||||||||||||||
Sectoral Performance
| ||||||||||||||||||||||||||
Advance Decline Ratio
| ||||||||||||||||||||||||||
Numbers to track
| ||||||||||||||||||||||||||
|
Please visit www.fisdom.com for a standard disclaimer. |
