
Technical Overview – Nifty 50
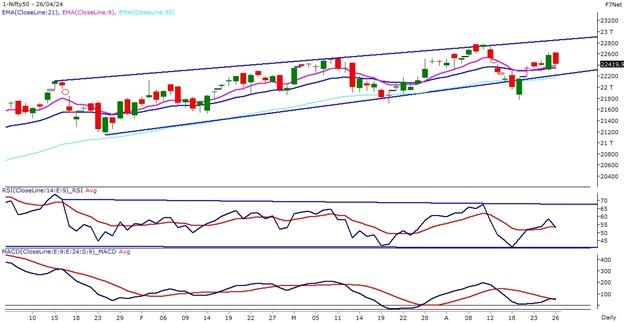
Nifty rollover stood at 65.12% which is significantly lower compared to last month’s rollover of 69.77% and its 3-month average and 6-month average of 71.25% and 74.48% respectively. Nifty rose 1.09% from 22,327 to 22,750 in the April series. Lower rollover with an increase in open interest and a price increase indicates hesitancy to carry forward the existing positions in the May series.
The Benchmark index witnessed a flat opening on the last day of the week and prices traded above 22,500 levels for the majority of time. Later on, as the day progressed the prices witnessed a breakdown of a smaller degree trend line on the intraday chart and drifted lower.
The Index has formed a spinning top candle stick pattern on the weekly time frame suggesting a narrow range movement with an escalated volatility. Nifty50’s futures Contract expiring on 30th May 2024 is trading at its lowest premium in the last 1 year compared to the underlying Nifty price.
A situation where the future prices are above the spot prices is normally known as Contango. This circumstance is generally a sign of bullishness. The immediate support for the Index is placed at 22,300 levels and resistance is capped at 22,700 levels. If the Index witnessed a breakdown below 22,300 levels, then the gate is open till 22,100 marks. Similarly, a close above 22,700 will trigger more upside till the 23,000 level.
Technical Overview – Bank Nifty
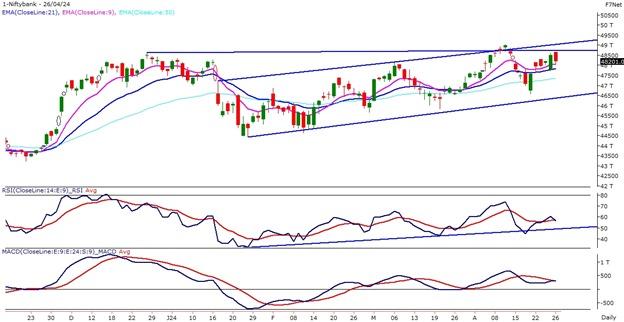
The Banking index witnessed a flat opening on the last day of the week and prices traded near 48,500 levels for the majority of time. Later on, as the day progressed the prices witnessed a breakdown of a smaller degree trend line on the intraday chart and drifted lower.
The Index has faced a horizontal trend line resistance of 48,800 levels. Previously on a couple of days, prices faced resistance at the same levels and reversed from the resistance zone. The Index has formed a spinning top candle stick pattern on the weekly time frame suggesting a narrow range movement with an escalated volatility.
The prices have taken support near its 9 & 21 EMA and reversed sharply from there. The momentum oscillator RSI (14) is reading in a higher low formation above the upward-rising trend line on the daily chart. The oscillator presently has taken support of a trend line and has moved above 50 levels with a bullish crossover.
The immediate support for the Banking Index is placed at 47,800 levels and resistance is capped at 48,800 levels. If the Index witnessed a breakdown below 47,800 levels, then the gate is open till the 47,000 mark. Similarly, a close above 48,800 will trigger more upside till the 49,500 levels.
Indian markets:
- The Sensex and the Nifty 50, key benchmarks in the Indian stock market, concluded their five-day winning streak on April 26, influenced by mixed global cues, while Indian equity indices closed lower on the same day, breaking the five-day gaining streak, with the Nifty dipping below 22,400 despite volatility.
- Notably, sectors such as auto, bank, and capital goods remained resilient, while others saw gains, including oil & gas, healthcare, realty, and media, rising by 0.3-1 percent.
- Additionally, the BSE midcap index showed a gain of 0.8 percent, while the smallcap index saw a modest increase of 0.3 percent.
Global Markets:
- Asia-Pacific markets were higher after the Bank of Japan kept its benchmark policy rate at 0%-0.1%, as expected. The Japanese yen slid against the U.S. dollar on the move.
- The Nikkei Stock Average index advanced by 0.81% to close at 37,934.76, while the broader Topix index rose by 0.86% to 2,686.48.
- Hong Kong’s market rose for the fifth consecutive session on April 26, 2024, fueled by upgraded views on Chinese shares and record onshore share purchases by overseas investors.
- On April 26, 2024, Mainland China’s market rose for the third consecutive session on positive risk sentiment and record onshore share purchases by overseas investors.
- The Shanghai Composite index rose by 1.17%, the Shenzhen Composite Index added 1.78%, and the blue-chip CSI300 index climbed by 1.53%.
- However, Australia’s market finished sharply lower in post-holiday trading on April 26, 2024, with the S&P/ASX200 index falling by 1.39% and the All-Ordinaries index down by 1.26%.
- European markets were higher Friday, regaining momentum after a dip in yesterday’s session.
Stocks in Spotlight
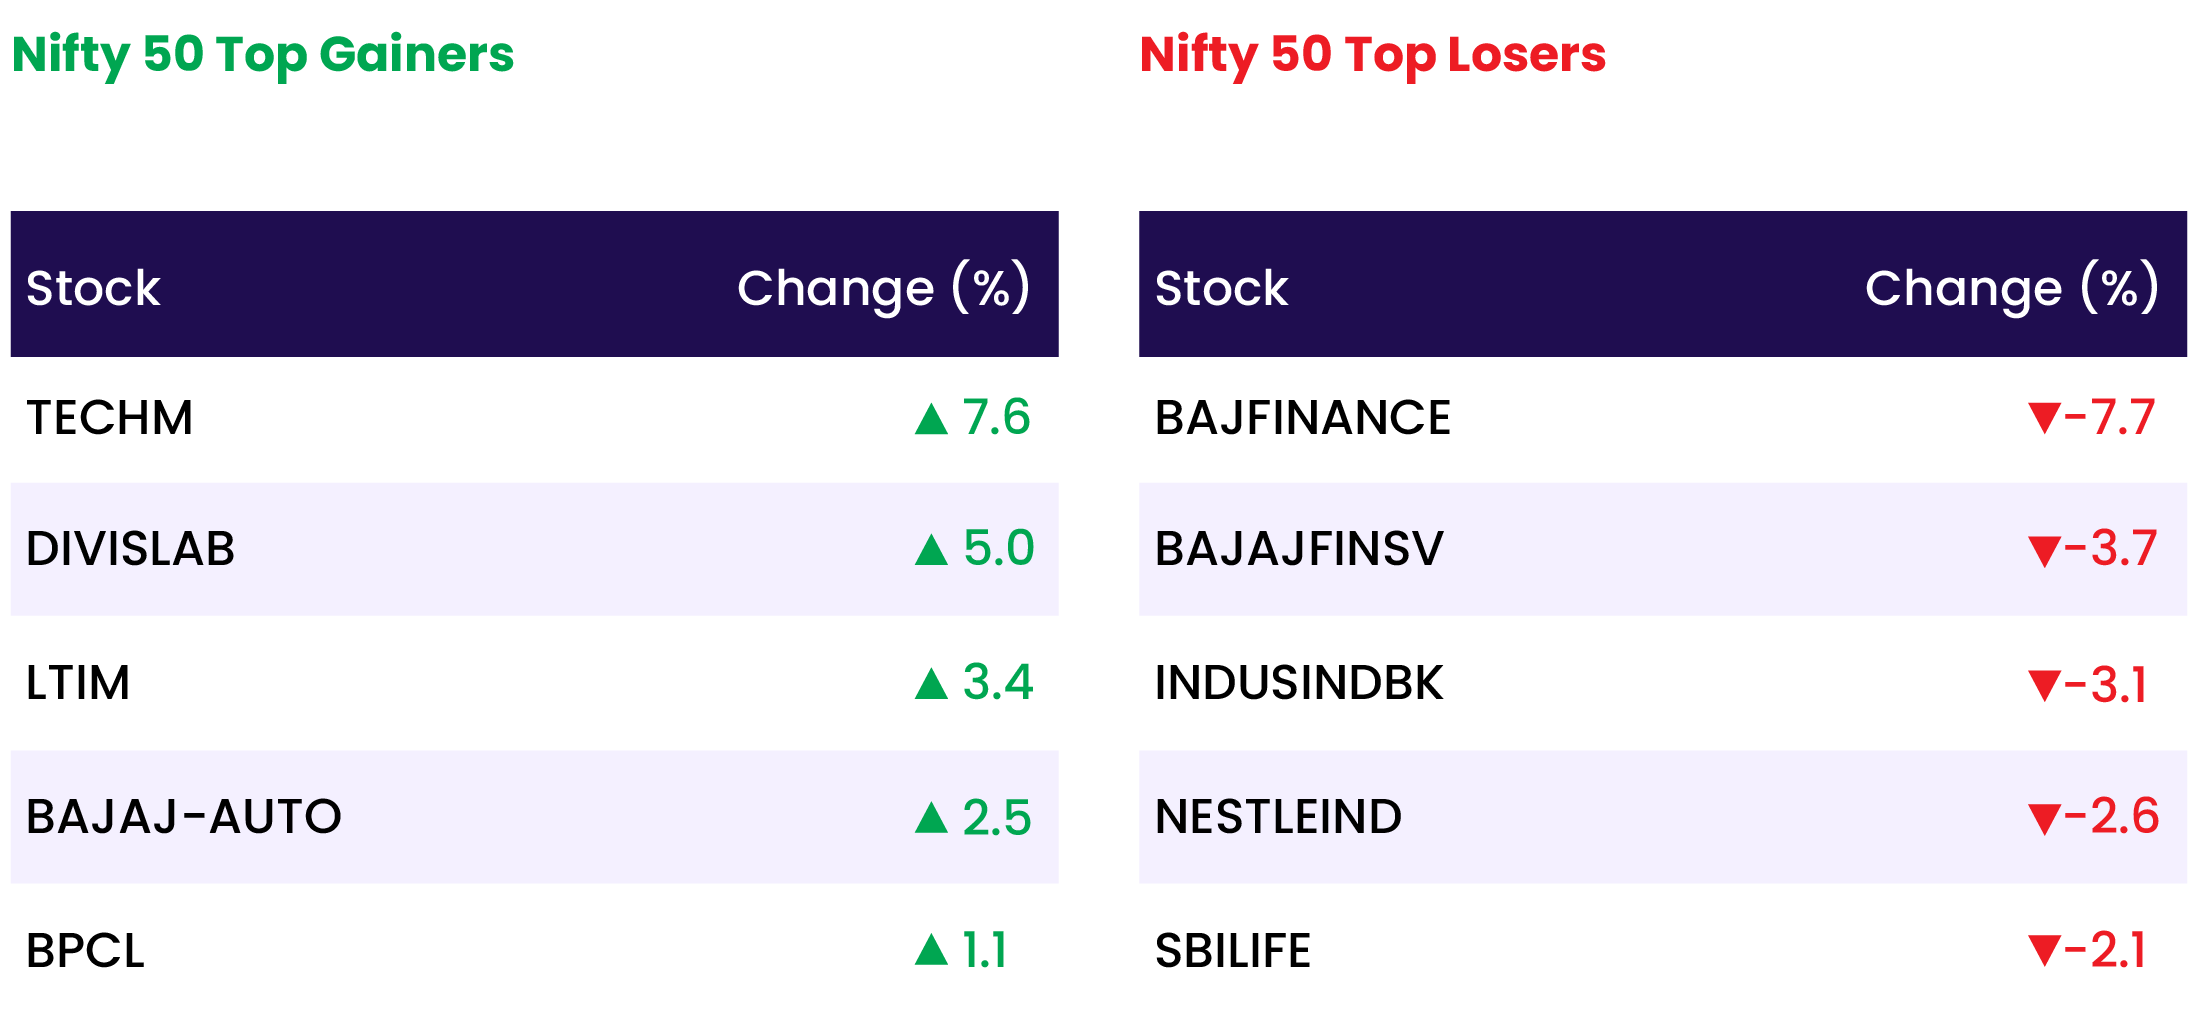
- Tech Mahindra shares surged by 7 percent following CEO and MD Mohit Joshi’s unveiling of a three-year roadmap on April 25 aimed at revitalizing the IT services major’s slowing business. The plan targets surpassing peer average revenue growth and optimizing margin improvement by FY27.
- L&T Tech stock experienced a sharp decline of over 7 percent. This followed the IT firm’s announcement of a projected 100 basis points drop in its FY25 EBIT margin. The company’s strategic focus is on cultivating capabilities for future growth, coupled with a conservative revenue outlook.
- Vedanta shares rose by 4 percent the day after the metals and mining player announced better-than-expected results for the fourth quarter. Despite a 27 percent profit decline at Rs 1,369 crore, attributed to rising finance costs and weak metal prices, Vedanta is on track to complete its alumina, aluminum, and international zinc expansion by FY25, promising volume growth and cost reduction from FY26 onwards, as noted by Nuvama Institutional Equities, which reiterated its “buy” recommendation and raised the target price to Rs 542 from Rs 394.
- Interglobal Aviation saw a 3 percent surge in its shares following the company’s order of 30 firm A350-900 aircraft from Airbus on April 25, facilitating the aviation major’s network expansion. Presently, IndiGo operates a fleet of over 350 aircraft.
News from the IPO world🌐
- Swiggy secures shareholder nod for a potential $1.2 billion IPO
- RCRS Innovations files draft papers with NSE Emerge to raise funds via IPO
- FirstCry set to withdraw $500 million IPO papers after regulatory scrutiny
Daily Leader board:
Sectoral Performance
| Top Sectors | Day change (%) |
| NIFTY CONSUMER DURABLES | 1.7 |
| NIFTY MEDIA | 1.2 |
| NIFTY MIDSMALL HEALTHCARE | 0.9 |
| NIFTY PHARMA | 0.6 |
| NIFTY REALTY | 0.6 |
Advance Decline Ratio
| Advance/Declines | Day change (%) |
| Advances | 1920 |
| Decline | 1866 |
| Unchanged | 127 |
Numbers to track
| Indices Name | Latest | % 1D | % YTD |
| Dow Jones (US) | 38,086 | (1.0) % | 1.0 % |
| 10 Year Gsec India | 7.2 | (0.2) % | 1.2 % |
| WTI Crude (USD/bbl) | 83 | (3.1) % | 17.5 % |
| Gold (INR/10g) | 72,157 | 0.6 % | 5.4 % |
| USD/INR | 83.31 | 0.0 % | 0.3 % |
Please visit www.fisdom.com for a standard disclaimer

