Daily Snippets
Date: 30th November 2023 |
|
|
Technical Overview – Nifty 50 |
|
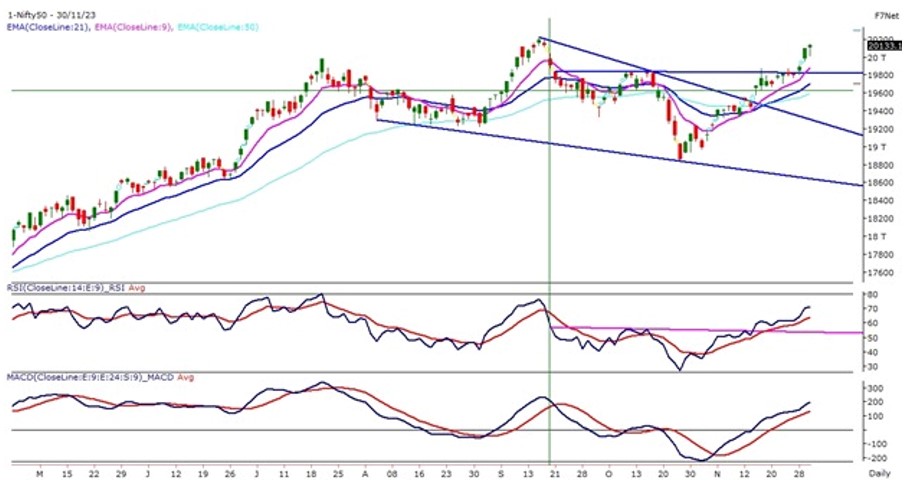
The Nifty50 on its monthly expiry day witnessed a flat opening above 20,100 levels traded within the tight range throughout the day and closed the November month with a massive gain of more than 5%. The Index has formed a tall bullish candle on the monthly chart and has engulfed its previous four months’ candles suggesting a solid buying.
The Index on the daily chart has also given a horizontal trend line breakout and prices are trading above the range of the breakout. The prices on the daily chart post 26th October, are trading in a higher high higher low formation and constantly trading above their 9 & 21 EMA.
The momentum oscillator RSI (14) is reading in a higher high formation post-26th October and has also given a horizontal trend line breakout near 50 levels and moved higher with a bullish crossover. The immediate support for the Index has shifted higher near 20,000 levels as prices have witnessed a range breakout and the immediate resistance is likely to be capped below 20,250 levels.
|
Technical Overview – Bank Nifty |
|
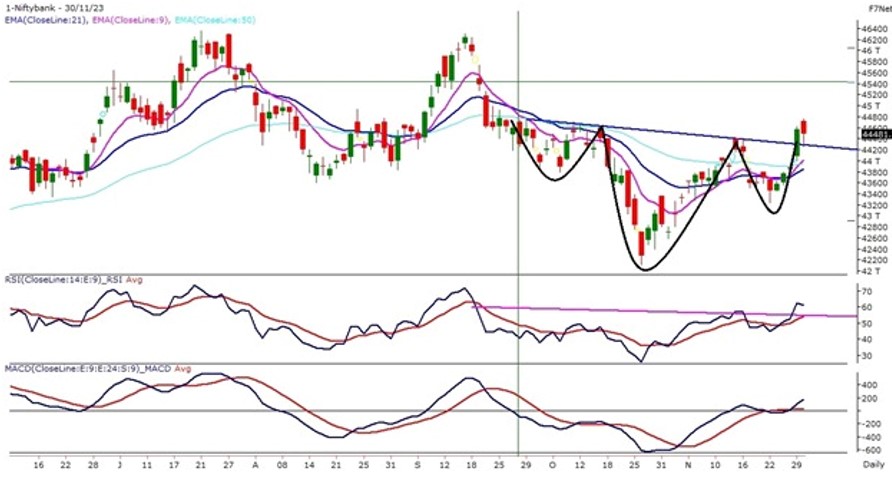
The Bank Nifty on its monthly expiry day witnessed a super volatility where prices registered an intraday low at 44,254 levels and post that witnessed a smart recovery of more than 200 points from the day’s low. The Banking Index has formed a tall bullish candle on the monthly chart and has formed a bullish piercing candle stick pattern with a gain of close to 4%.
The Bank Nifty on the daily chart has witnessed an inverted head & shoulder pattern breakout and the index has closed above the neckline of the pattern. On 30th November the prices completed the retest of the pattern near the neckline support. The momentum oscillator RSI (14) is reading in a higher high formation post-26th October and has also given a horizontal trend line breakout near 60 levels and moved higher with a bullish crossover.
Presently the Index is trading comfortably above its short and medium-term averages on the daily time frame, which is a positive sign for the index. The immediate support for the Banking Index has shifted higher near 44,200 levels as prices have witnessed a range breakout and the immediate resistance is likely to be capped below 45,400 levels.
|
Indian markets:
- The domestic stock market exhibited resilience amidst volatility, advancing on Thursday.
- Sectors such as pharma, capital goods, and oil & gas contributed to the gains.
- Initially, the day began with mild gains, but there was a dip in the Nifty, dropping close to the 20,000 level during the early hours.
- Despite this, the market managed to conclude with slight gains, influenced by positive global cues and monthly derivatives rollover.
- The upbeat sentiment stemmed from S&P Global Ratings upgrading India’s GDP growth forecast to 6.4% for FY24, which enhanced long-term prospects.
- Despite the positive indicators, investor caution is expected due to pending state exit poll results and the final outcome slated for announcement on Sunday.
|
Global Markets
- European shares rose after French inflation slowed to 3.4% in November from 4% in October, while French GDP showed a 0.1% decline in the third quarter. German retail sales increased by 1.1% in October, driven by non-food items, but annual sales declined slightly by 0.1%.
- Asian markets closed higher despite China?s factory activity shrinking for a second month, with Japans retail sales rising 4.2% and industrial output increasing more than expected. South Koreas central bank held its benchmark policy rate at 3.5%, anticipating a slowdown in inflation.
- US stocks remained stable despite the economy growing more than expected in the third quarter. Investors awaited clarity on inflation from Euro Zone consumer inflation figures and the Fed Chairs upcoming speech.
|
Stocks in Spotlight
- Tata Technologies experienced a remarkable surge, catapulting around 168 percent from its issue price and solidifying its position as the seventh highest-listed company in India. Upon opening, the stock showcased an impressive 140 percent premium, swiftly reaching Rs 1,334 on the BSE within minutes—marking an astounding 168 percent increase from its issue price. This surge reflects the enthusiastic response and considerable demand for the company’s stock among investors.
- Aurobindo Pharma concluded trading with a 2.31 percent increase following the approval granted by the US Food and Drug Administration (USFDA) to its wholly owned subsidiary. This approval allows the subsidiary to produce and market an asthma medication. The positive market response indicates investor confidence in the company’s prospects, potentially bolstering its position within the pharmaceutical industry.
- General Insurance Corporation of India (GIC Re) sustained its impressive performance on November 30, marking a rise of approximately 7.5 percent. Over the past seven days, the stock has surged by over 35 percent, demonstrating an astounding 50 percent increase in just 15 days. This remarkable momentum has propelled the company’s market capitalization to Rs 55,834 crore. The surge is largely credited to GIC Re’s commendable financial performance, recent credit rating upgrade, and optimistic future outlook, factors that have contributed significantly to investor confidence and the stock’s upward trajectory.
|
News from the IPO world🌐
- Rockingdeals Circular SME IPO surges 125% on debut
- Gandhar Oil IPO lists at 75% premium to IPO price
- SEBI sounds alarm on crowding of IPOs
|
|
Day Leader Board
Nifty 50 Top Gainers | Stock | Change (%) | | ULTRACEMCO | ▲ 3.1 | | HDFCLIFE | ▲ 2.4 | | APOLLOHOSP | ▲ 2.3 | | BHARTIARTL | ▲ 2 | | SUNPHARMA | ▲ 1.9 |
| Nifty 50 Top Losers | Stock | Change (%) | | ADANIENT | ▼ -1.3 | | INDUSINDBK | ▼ -1.1 | | ADANIPORTS | ▼ -1 | | LTIM | ▼ -1 | | RELIANCE | ▼ -0.9 |
| |
Sectoral Performance | Top Sectors | Day change (%) | | NIFTY HEALTHCARE INDEX | 1.78 | | NIFTY PHARMA | 1.56 | | NIFTY REALTY | 1.44 | | NIFTY CONSUMER DURABLES | 1.41 | | NIFTY OIL & GAS | 0.73 |
|
Advance Decline Ratio | Advance/Declines | Day change (%) | | Advances | 1823 | | Declines | 1881 | | Unchanged | 153 |
|
Numbers to track | Indices Name | Latest | % 1D | % YTD | | Dow Jones (US) | 35,430 | 0.0 % | 6.9 % | | 10 Year Gsec India | 7.3 | 0.40% | -0.90% | | WTI Crude (USD/bbl) | 78 | 1.9 % | 1.2 % | | Gold (INR/10g) | 62,470 | 0.10% | 11.60% | | USD/INR | 83.36 | (0.0) % | 0.8 % |
|
|
Please visit www.fisdom.com for a standard disclaimer.
|
