
Sectoral Technical Outlook (1/2)
| Index Name | Trend | Pattern/Formation | Strategy |
| NIFTY Realty Index | Bullish | Bearish candlestick on monthly chart, double bottom on RSI | Buy on dips; support at 990/950, resistance at 1100/1150 |
| NIFTY Auto Index | Bullish | DOJI candlestick, RSI breakout | Buy during declines; support at 24,500/24,000, resistance at 27,500/27,800 |
| Industrial Index | Bullish | Symmetrical triangle on RSI | Positive outlook; support at 15,000, resistance at 16,500/16,800 |
| BSE Capital Goods Index | Bullish | Higher low structure, bullish RSI | Buy above 76,300; support at 71,000/68,500, resistance at 76,300/77,000 |
| Telecom Index | Bullish | Rectangle pattern breakout | Buy on dips; support at 3,000, resistance at 3,500/3,700 |
| Banking Index | Bullish | DOJI candlestick, RSI retesting trendline | Buy on dips; support at 56,500/55,500, resistance at 60,500/61,500 |
Sectoral Technical Outlook (2/2)
| Index Name | Trend | Pattern/Formation | Strategy |
| NIFTY Energy Index | Bullish | DOJI candlestick, hidden bullish divergence on RSI | Buy on dips; support at 42,000, resistance at 45,000/46,000 |
| BSE Healthcare Index | Bullish | Bullish pennant breakout, higher-high MACD | Buy on dips; support at 39,500/38,500, resistance at 43,500/44,000 |
| BSE Basic Material Index | Bullish | Rising wedge, RSI in bullish range shift | Buy on dips; support at 7,300, resistance at 7,900 |
| BSE FMCG Index | Bullish | Cup & Handle breakout on RSI | Buy on dips; support at 22,500/21,500, resistance at 23,500/24,000 |
| BSE Consumer Durable Index | Bullish | Symmetrical triangle on RSI | Buy on dips; support at 61,500/60,500, resistance at 64,500 |
| NIFTY IT Index | Bullish | Cup & Handle on RSI, bullish MACD | Buy on dips; support at 41,500/41,000, resistance at 43,500/44,500 |
Realty Index
Nifty Realty index has formed a bearish candlestick formation
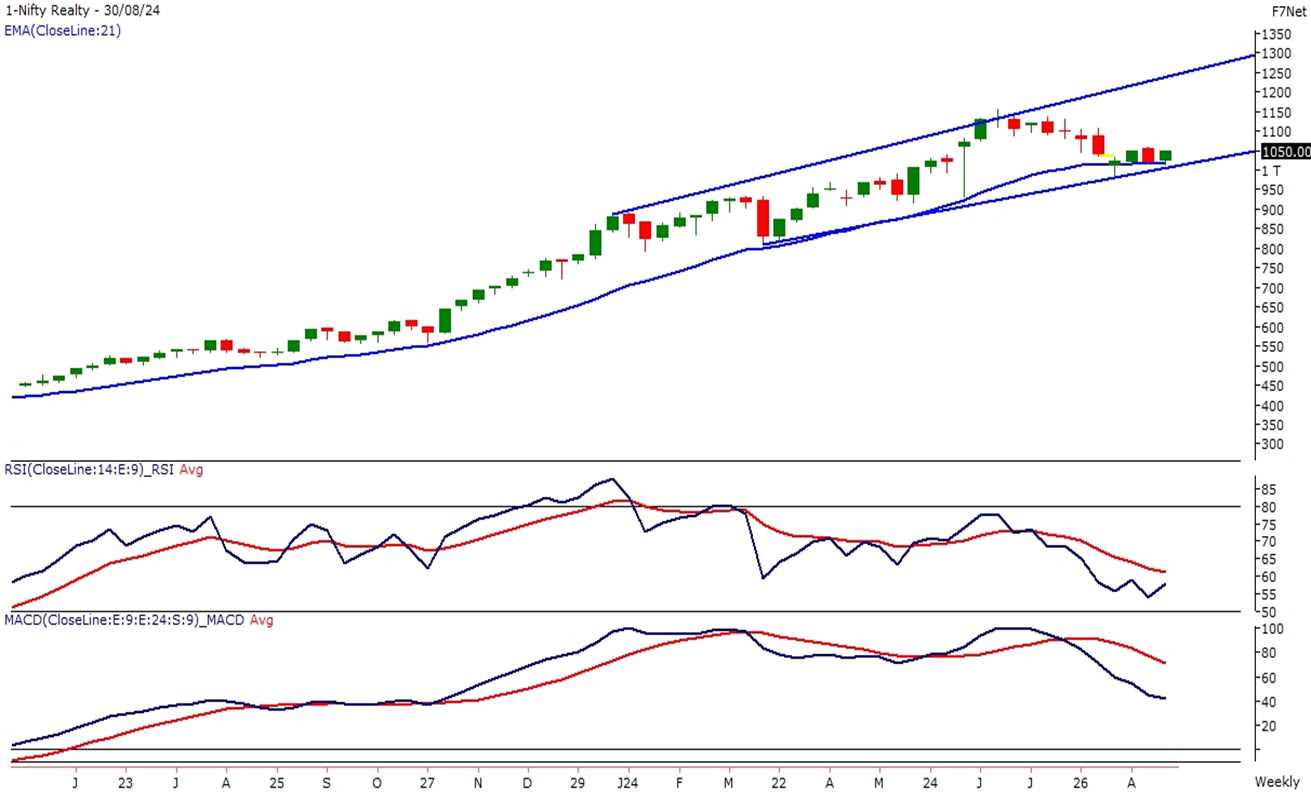
The Realty Index dipped during August, hovering near the lower range of the rising channel on the weekly chart. The index dropped over 3.50 % all through the month. On a monthly basis, the index has formed a bearish candlestick formation.
On a weekly basis, the index has found support between the 10 and 20 EMAs, reaching about 990. The index indicates strong momentum, as it is above all important moving averages over all major timeframes. The momentum indicator (14) fell to 78, retesting the previous breakout level and signaling a shift in polarity. The RSI is forming a double bottom structure and has hidden bullish divergence, with support near the 55 mark on the weekly chart. The MACD is above its polarity and is still rising, which supports the general bullishness.
Overall, the outlook is still optimistic; buying on dips is advised, with near-term support around the 990 and 950 levels and resistance around the 1100 and 1150 levels
Auto Index
NIFTY AUTO index is finding support at the weekly chart’s rising trend line
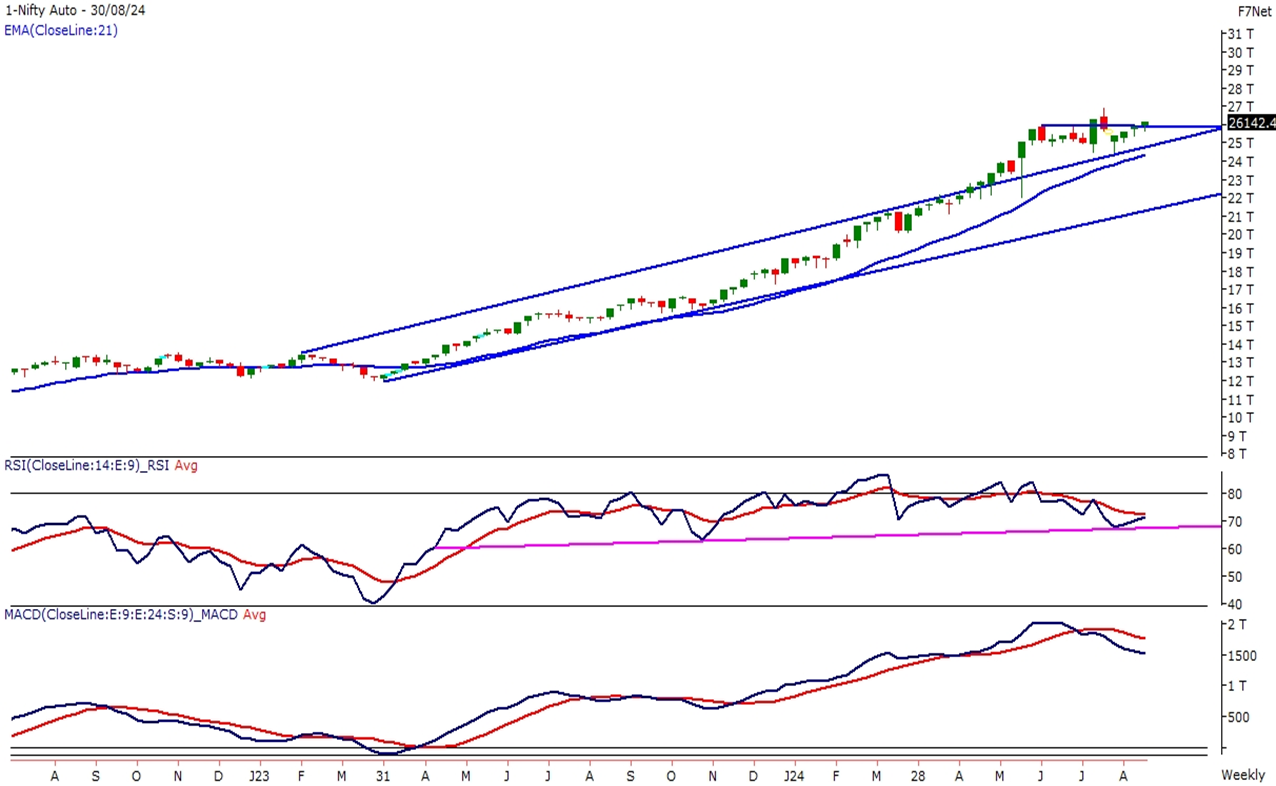
NIFTY AUTO halted its upward trend and saw some selling from ATH levels. For the month of August, the index fell over 2%. The index set a new all-time high of 26,934, making a DOJI candlestick on the monthly chart. Though the index fell, follow-up buying was witnessed from the 24,500 level, which acted as a decent support zone. The Index is finding support at the weekly chart’s rising trend line.
On a monthly timeframe, the momentum indicator, RSI (14) has broken above horizontal resistance and is still above it. The MACD indicator is above its polarity and rising, which supports the index’s overall upward trend. Weekly, the index has found support at the 10 and 20 exponential moving averages (EMAs). The index is displaying strong momentum because it is above all important moving averages across all major timeframes.
The advice is still to buy during declines when prices consistently sustain over the weekly 10 EMA. The Auto index is long with support at 24,500, and 24,000. The Index will also rise to 27,500 and 27,800 levels after holding levels above 27,000.