
Utilities
Highlights: Index on weekly time has witnessed a consolidation breakout after a brief consolidation
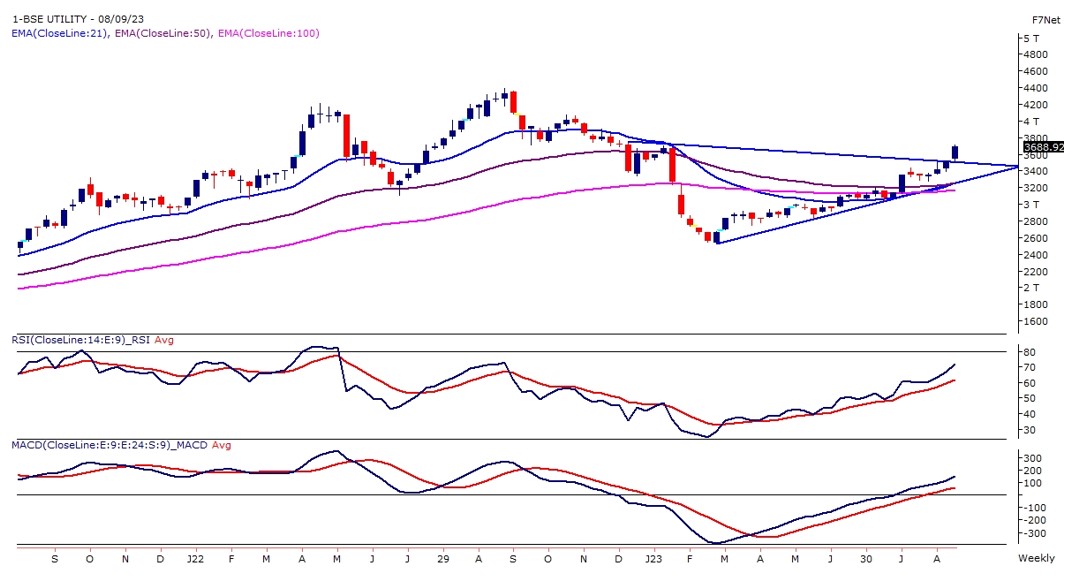
-0.6% returns for August 2023
The UTILITIES Index on weekly time has witnessed a consolidation breakout after a brief consolidation and presently trading above the upper band of the pattern. The UTILITIES Index is trending above the golden cross on the weekly chart. Technically, the bullish crossover of 21EMA over 50EMA & 100EMA is known as the ‘golden cross’ – the short to medium-term bullish trend.
On the lower panel momentum, oscillator RSI (14) is moving in a higher high higher bottom formation with a bullish crossover on the cards. The MACD indicator has moved above its line of polarity with a bullish crossover.
Technically UTILITIES Index is trading in a bullish terrain and buying on present levels can be initiated with immediate support of 3,600 – 3,550 levels and on the higher side 3,850 – 4,000 are likely to be seen in the index.
Industrials
Highlights: Index trades within the rising channel pattern in a higher high higher bottom formation
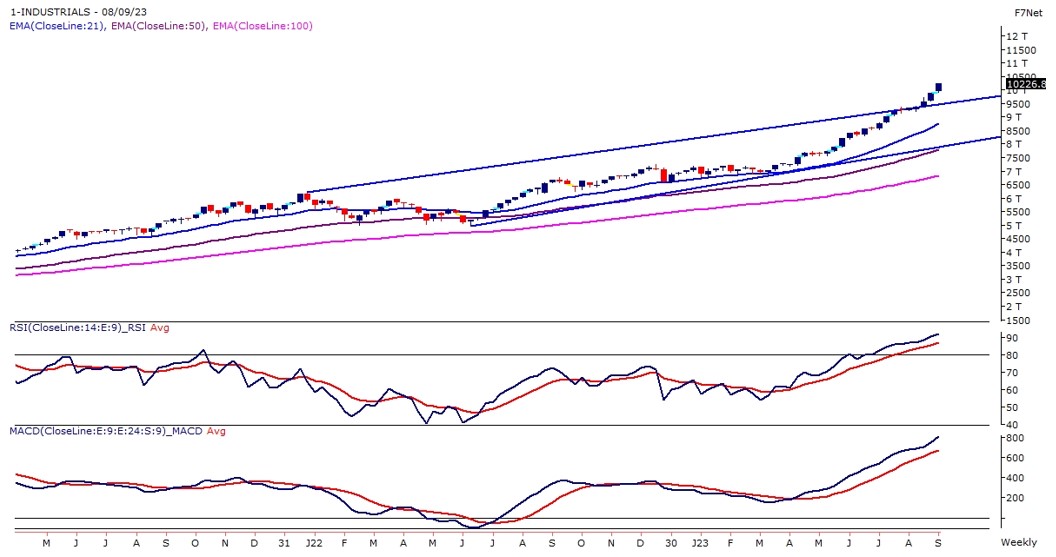
4.7% returns for August 2023
The INDUSTRIAL Index trades within the rising channel pattern in a higher high higher bottom formation on the weekly time frame. The prices have recently witnessed a breakout of a rising channel pattern which confirms the strong bullish strength in the Industrial Index.
The BSE INDUSTRIAL INDEX has not formed any bearish candle in the past 6 months on the monthly chart which suggests the strength of the bullish breakout. The momentum oscillator RSI (14) is reading near 90 levels, an extremely overbought zone for an oscillator. The distance between the 21-week exponential moving average and prices has increased drastically and in the near term index may correct a little and come closer to the average.
The immediate buying should be avoided and one should wait for a dip in the index for a fresh entry. A dip near 9,800 – 9,650 will be an opportunity to enter with support near 9,500 – 9,400 levels.
Realty
Highlights: Index has witnessed a rectangle pattern breakout which is placed at 560 levels
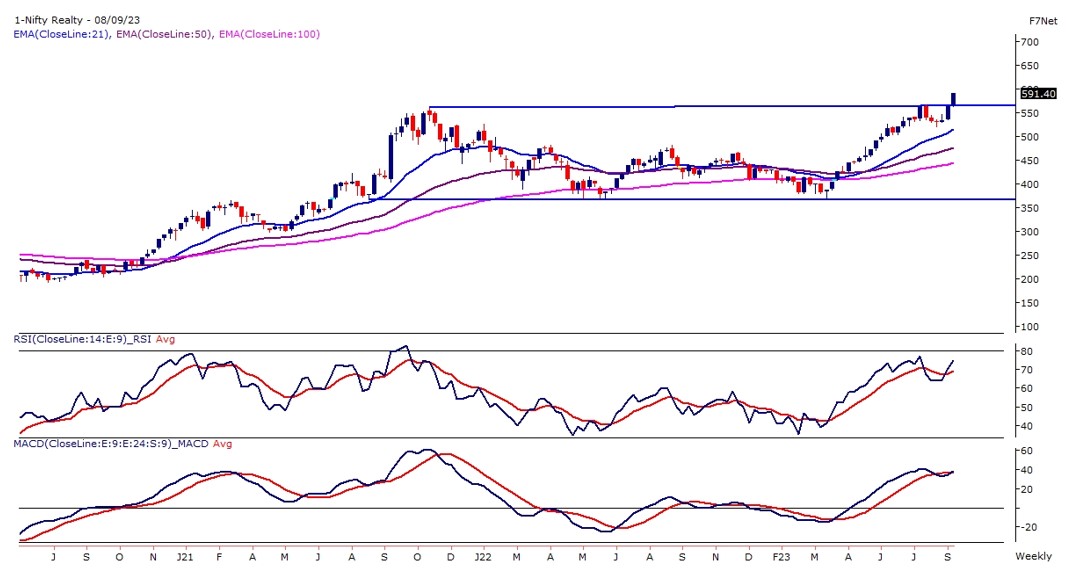
-1.5% returns for August 2023
NIFTY REALTY INDEX has been trading in a rectangle pattern for the past two years between the 300-point band. The Realty index has witnessed a rectangle pattern breakout which is placed at 560 levels and presently closed above the same.
The prices earlier paused near the trend line resistance and consolidated for more than a month which indicates a breakout has been witnessed post-consolidation and hence prices are likely to move ahead without much interruption.
The index is trading above its 21, 50 & 100 WEMA, and the momentum oscillator RSI (14) has formed a bullish cup & handle formation and reading in a bullish crossover mode. A convincing move above 590 levels will initiate a fresh buying spurt in the Realty Index which may head towards 630 – 650 levels. The immediate support of the index stands at 560 – 545 levels.
Capital Goods
Highlights: Index has given more than 15 Percent returns in the past 3 months
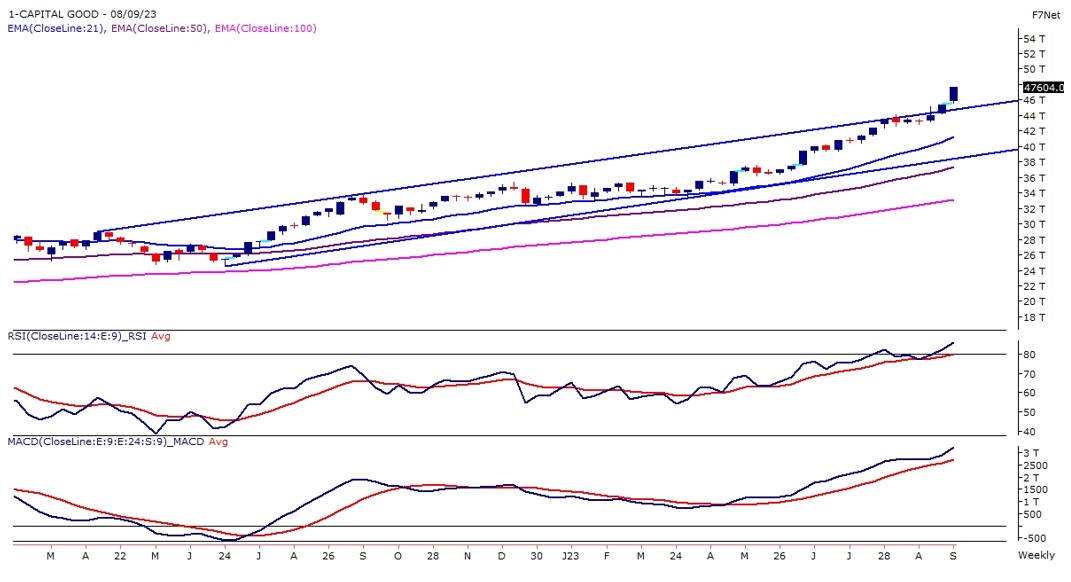
2.7% returns for August 2023
The CAPITAL GOODS Index has given more than 15 Percent returns in the past 3 months and continues to trade in a higher high higher bottom formation. The prices have recently witnessed a breakout of a rising channel pattern which confirms the strong bullish strength in the Industrial Index.
The BSE CAPITAL INDEX has not formed any bearish candle in the past 6 months on the monthly chart which suggests the strength of the bullish breakout. The momentum oscillator RSI (14) is reading near 85 levels, an extremely overbought zone for an oscillator. The distance between the 21-week exponential moving average and prices has increased drastically and in the near term index may correct a little and come closer to the average.
The immediate buying should be avoided and one should wait for a dip in the index for a fresh entry. A dip near 46,000 – 45,000 will be an opportunity to enter with support near 44,000 – 43,000 levels.
Source: BSE, Fisdom Research