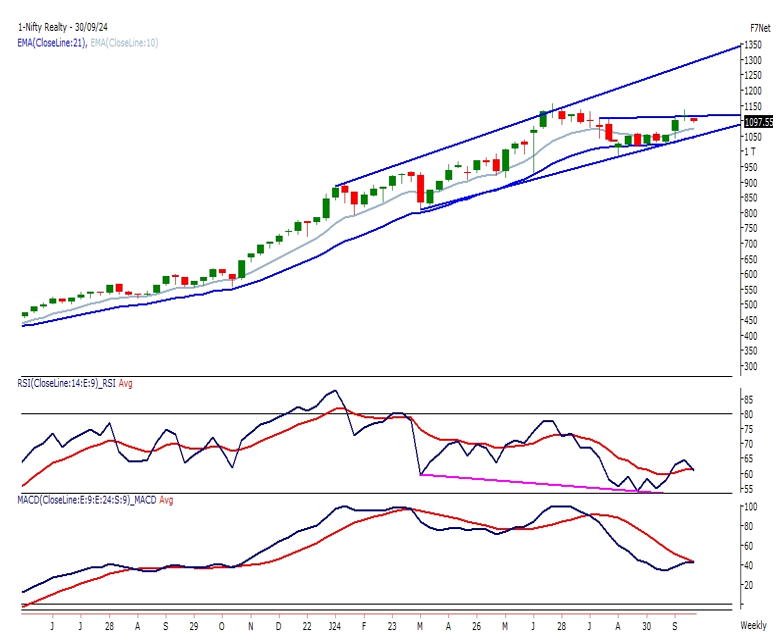
Realty: A smaller degree trendline breakout occurred after six weeks of consolidation, indicating bullish formation

Trend Formation
The Nifty Realty Index gained over 4% in September, forming bullish candles after two bearish months. A smaller trendline breakout occurred after six weeks of consolidation, indicating a bullish trend.
Weekly Analysis
The index found support around 990, staying above the 10 and 20 EMAs, showing strong momentum across all timeframes.
Momentum Indicators
RSI (14): Forming a double bottom with hidden bullish divergence, supporting near 55.
MACD: Rising above its polarity, reinforcing the bullish outlook.
Key Levels
Support: 1,050 and 1,000
Resistance: 1,175 and 1,200
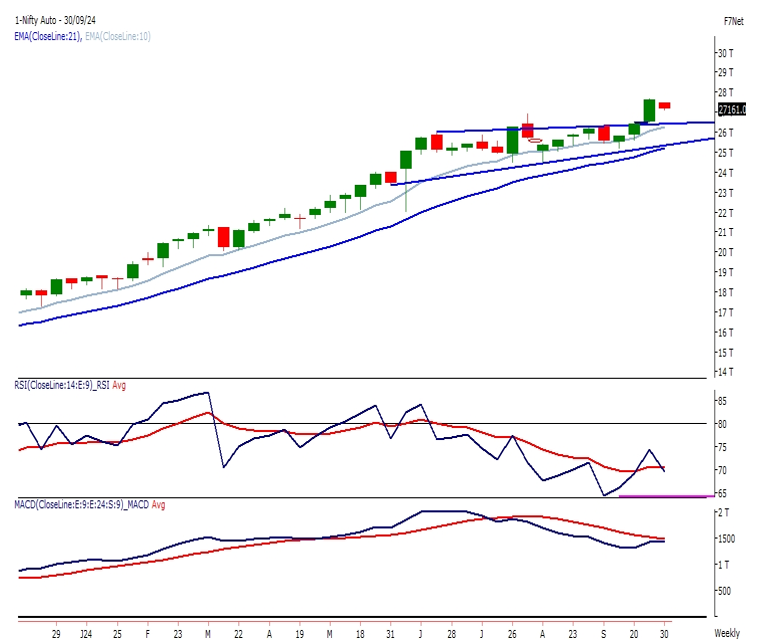
Auto: It formed a bullish candle for the month, indicating strength

Trend Formation
The Nifty Auto Index resumed its uptrend, gaining nearly 4% in September and forming a bullish candle, indicating strength.
Weekly Analysis
Consolidation Breakout: A 17-week consolidation ended with a range breakout, signaling trend continuation.
Support: Found support at the 10 and 20 EMAs, reinforcing the uptrend.
Momentum Indicators
RSI (14): Broke above resistance on the monthly chart, showing strong momentum.
MACD: Rising above polarity, confirming a bullish outlook.
Key Levels
Support: 26,500 and 26,000
Resistance: 28,500 and 29,000 if it holds above 27,500
Buy on dips, especially when the index sustains above the weekly 10 EMA
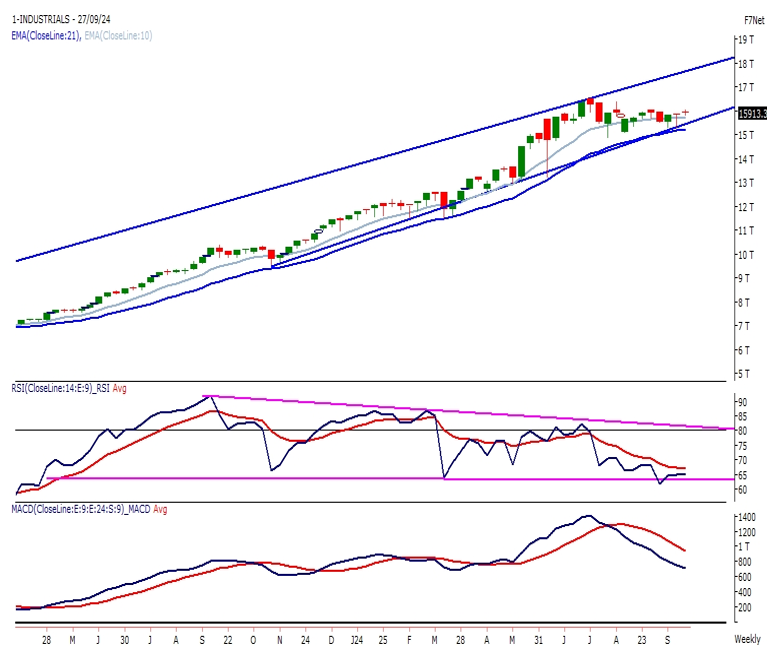
Industrial: The index is currently hovering near the lower band of an ascending channel, watch for dips

Trend Formation
The Industrial Index traded flat in September, forming a Doji-like candle and hovering near the lower band of an ascending channel.
Weekly Analysis
Support: The 10 EMA is key on the weekly chart, with the index remaining above all major EMAs. The 20 EMA provides consistent support.
Momentum Indicators
RSI (14):Around 60, forming a triangle pattern on the weekly chart, hovering near the rising trend line.
MACD: Rising beyond polarity, supporting bullish momentum.
Key Levels
Support: 15,000
Resistance: 16,200, with potential to reach 16,800
Outlook remains positive. A break above 16,200 could lead to further gains, and dips near 15,000 present buying opportunities.
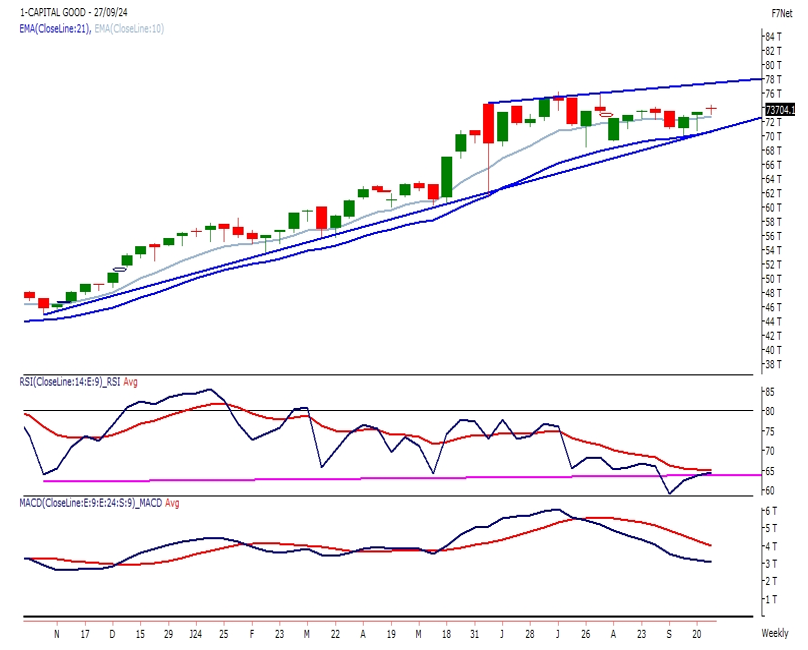
Capital Goods: The index is currently trading flat but forming a bullish candle, watch for dips

Trend Formation
The Capital Goods Index remained volatile in September, forming a bullish candle with a Doji-like structure and a lower tail, consolidating between 68,600 and 76,300, indicating potential buying above 76,300.
Weekly Analysis
Support: The index is above all key EMAs and has challenged the 20 EMA, reinforcing bullish sentiment.
Momentum Indicators
RSI (14): In a bullish range shift (60-80), indicating a bullish to sideways tone.
MACD: Rising above polarity, supporting the bullish outlook.
Key Levels
Support: 71,500 and 70,000
Resistance: 76,000 and 77,000
The outlook is bullish. Watch for buying opportunities above 76,300, with support around 71,500 and 70,000.


