Sector Summary At Glance
| Index Name | Pattern Formation | Strategy |
| Realty | Bearish Trends Signal Profit Booking and Downside Potential | Sell on rise |
| Auto | Bearish belt-hold candle stick pattern | Sell on rise |
| Industrial | Bearish Signals Amid Range-Bound Outlook & Rising Channel Breakdown | Monitor for breakdown below 14,000 |
| Capital Goods | Bearish Signals Amid Rounding Top and Rectangle Pattern | Monitor for range-bound movement |
| Telecom | Bearish engulfing candlestick at all-time high levels | Avoid fresh buying; wait for breakout or breakdown |
| Bankex | Rising Channel with Higher Highs and Higher Lows | Avoid fresh buying; wait for breakout or breakdown |
| Energy | Bearish belt-hold candlestick pattern engulfing the previous four months | Sell on rise |
| Healthcare | Range-Bound Outlook with Key Levels for Breakout and Breakdown | Monitor for breakout or breakdown |
| Basic Material | Bearish engulfing candlestick pattern at all-time high levels | Watch for profit booking |
| FMCG | Rising channel pattern with resistance at the upper band, bearish belt-hold candlestick | Monitor for breakdown or breakout |
| Consumer Durables | Rising channel pattern with resistance near upper band | Monitor for breakdown or breakout |
| IT | Bullish cup and handle pattern breakout on the weekly chart | Buy on breakout above 42,000 |
Note: Bottom-up opportunities are available across sectors.
Realty: Bearish Trends Signal Profit Booking and Downside Potential

Trend Formation
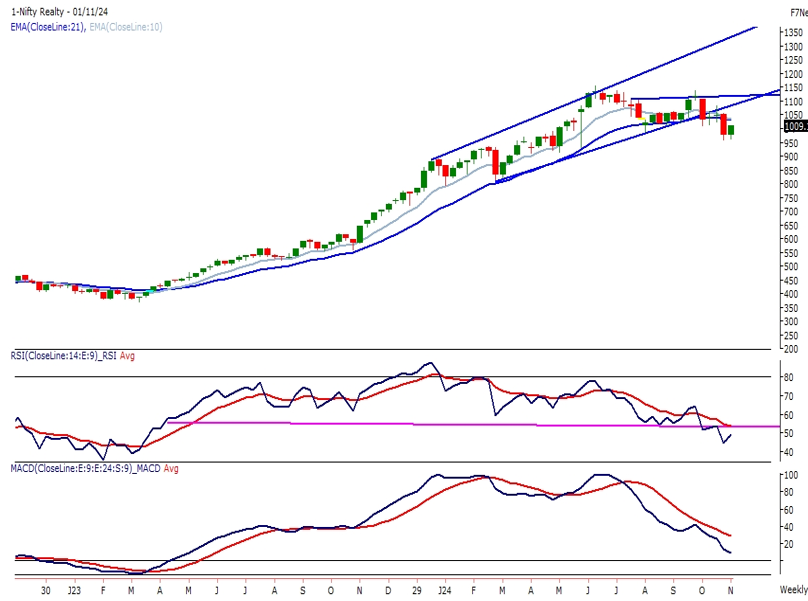
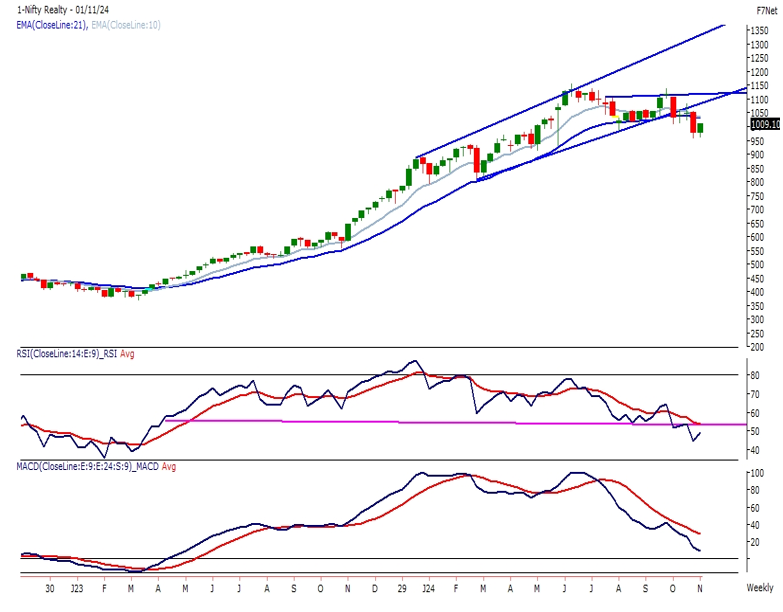
The Nifty Realty Index is showing a bearish trend with a strong downward movement, as it has drifted 100 points lower (almost 10% decline), indicating significant profit booking.
Weekly Analysis
On the weekly chart, the index has broken down from a rising channel pattern, with prices settling below the lower band of the pattern. This breakdown suggests a continuation of bearish momentum.
Momentum Indicators
RSI (14): The momentum oscillator RSI (14) has given a horizontal trend line breakdown below 50 levels with a bearish crossover.
Key Levels
Support: 950 and 900
Resistance: 1,100
The Realty Index presently indicates sell on sell-on-rise scenario where a bearish move will be neglected, only above 1100 levels
Auto: Bearish belt-hold candle stick pattern

Trend Formation
The Nifty Auto Index drifted more than 12% in October month and formed a bearish belt-hold candle stick pattern on the monthly chart. The tall bearish candle on the monthly chart has engulfed its previous four months, indicating a bear’s dominant month.
Weekly Analysis
On the weekly chart, the Index has given a rising channel pattern breakdown and the prices have settled below the lower band of the pattern. Index has moved below its 21 & 50 EMA.
Momentum Indicators
RSI (14): The momentum oscillator RSI (14) has given a horizontal trend line breakdown below 50 levels with a bearish crossover.
MACD: Bearish crossover but the indicator is still above its line of polarity which indicates early selling.
Key Levels
Support: 23,000 and 22,000
Resistance: 25,500
The Auto Index presently indicates sell on sell-on-rise scenario where a bearish move will be neglected only above 25,500 levels
Industrial: Bearish Signals Amid Range-Bound Outlook and Rising Channel Breakdown

Trend Formation
The Industrial Index recovered almost 800 points in the last four trading sessions in October month but still managed to close with a loss of 5% on the monthly chart. Presently the prices on the monthly chart are in the early stage of forming a rounding top formation.
Weekly Analysis
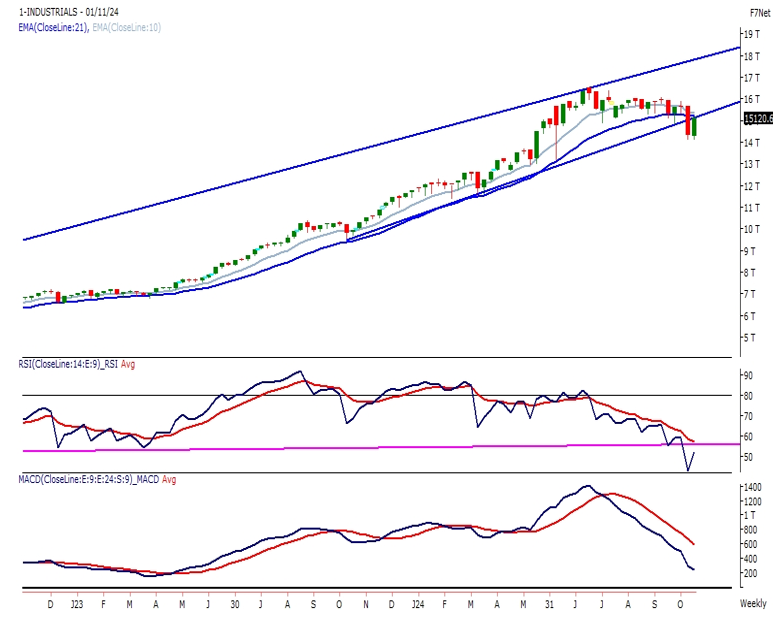
On the weekly time frame, the Index has given a rising channel pattern breakdown and the prices have settled below the lower band of the pattern. Index has moved below its 21 & 50 EMA
Momentum Indicators
RSI (14): The momentum oscillator RSI (14) has given a horizontal trend line breakdown below 50 levels with a bearish crossover.
MACD: MACD indicator has shown a bearish crossover but the indicator is still above its line of polarity which indicates early selling.
Key Levels
Support: 14,000
Resistance: 15,700
By observing the trend on the weekly and monthly charts the Industrial index is expected to trade within the range between 14,000 – 15,700 levels
Capital Goods: Bearish Signals Amid Rounding Top and Rectangle Pattern

Trend Formation
The Capital Goods Index recovered almost 450 points in the last four trading sessions in October month but still managed to close with a loss of 5.50% on the monthly chart. Presently the prices on the monthly chart are in the early stage of forming a rounding top formation.
Weekly Analysis
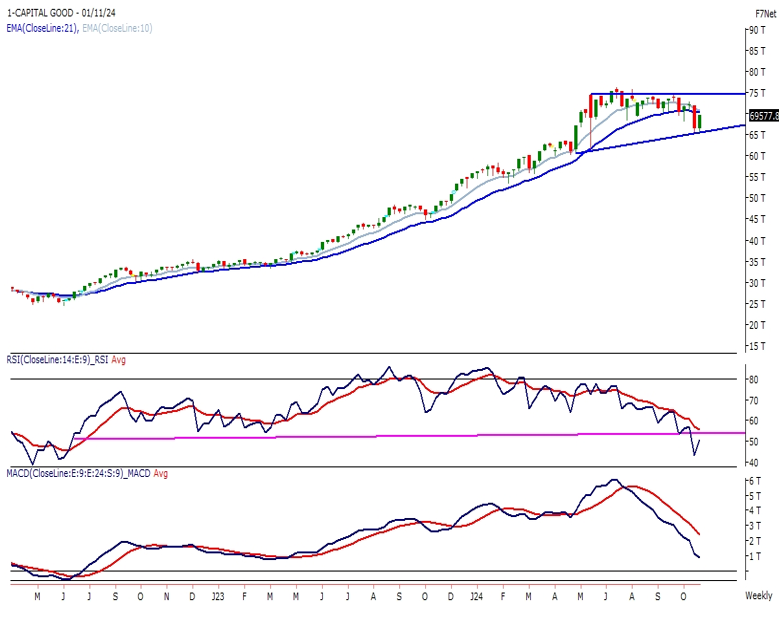
On the weekly time frame, the Index is trading in a rectangle pattern and exhibited volatility throughout the month.
Momentum Indicators
RSI (14): The momentum oscillator RSI (14) is reading in a lower low lower high formation and the index has drifted lower near 45 levels from the high of 80 levels.
Key Levels
Support: 65,000
Resistance: 71,000
A breakdown below 65,000 levels will trigger a bearish breakdown in the prices.


