Sectoral Technical Outlook (1/2)
| Index Name | Trend | Pattern/Formation | Strategy |
| Realty | Index has gained more than 6 percent gains for April 2024 | Index formed a tall bullish candle on the monthly time frame | The view remains Buy On dips where prices continuously rank above 21 EMA on the weekly scale. |
| Auto | Index is indicating a perfect bullish trend is unfolding | Index is trading in a higher high higher low formation within the rising channel pattern | The view remains Buy On dips where prices continuously rank above 21 EMA on the weekly scale. |
| Industrial | Index is indicating a perfect bullish trend is unfolding | Index is witnessing a bullish breakout of a rising channel pattern with a strong bullish texture. | The view remains bullish for the counter with immediate support placed at 12,500 levels and the upside momentum is likely to be capped near 14,700 levels. |
| Capital Goods | The rising channel pattern indicating a perfect bullish trend is unfolding | Index is witnessing a flag pattern breakout within the rising channel pattern with a strong bullish texture. | The view remains bullish for the counter with immediate support placed at 60,000 levels and the upside momentum is likely to be capped near 66,000 levels. |
| Telecom | The rising channel pattern indicating a perfect bullish trend is unfolding | Index has witnessed a rectangle pattern breakout within the rising channel pattern. | The view remains bullish for the Telecom Index with immediate support placed at 2,500 levels and the upside momentum is likely to be capped near 2,900 levels. |
| Bankex | Index on the weekly chart is trading in a rising channel pattern | Index has taken support near the 21 EMA and has formed a hammer candle stick pattern | Buying at present levels is advisable due to an attractive risk-reward ratio. Consider going long at the current stage for a target at 57,200 – 58,200 levels |
Sectoral Technical Outlook (2/2)
| Index Name | Trend | Pattern/Formation | Strategy |
| Energy | After witnessing a more than 35% rally from 28,000 to 39,000 the Nifty Energy Index is witnessing a time correction | Prices are trading within a narrow range rectangle pattern on the weekly time frame | The view remains bullish and a breakout above 40,600 levels will trigger prices to higher levels to 42,000 levels and the support for the Index is placed at 38,000 levels. |
| Healthcare | After witnessing a more than 35% rally from 28,000 to 35,500 the Nifty Energy Index is witnessing a time correction | Prices are trading within a narrow range rectangle pattern on the weekly time frame | The immediate support for the Index is placed at the 34,000 level and if prices witness a breakdown below this level then 32,500 will be the next level to watch. |
| Materials | Index has witnessed another bullish breakout of a horizontal trend line after consolidating in a narrow range | Post breakout index retested its trend line support zone and formed another tall bullish candle on the weekly scale | The view remains bullish for the MATERIAL Index with immediate support placed at 6,800 levels and the upside momentum is likely to be capped near 7,400 levels. |
| FMCG | The index presently witnessing a time-wise correction and the index | Index is forming a triangle pattern on the weekly time frame | The immediate support for the Index is placed at the 19,000 level and if prices witness a breakdown below this level then 18,500 will be the next level to watch. |
| Consumer Durables | Index is trading in a higher high higher low formation indicating a perceptual bullish trend in the index | Index has also witnessed a horizontal trend line breakout on the weekly chart at all-time high levels calling for a strong bullish trend | Buy-on dips will be the preferred strategy for the index. We will be partially long at current levels and will wait for a dip till 54,000 levels, with immediate support near 52,500 levels |
| Information Technology | Index on the weekly has witnessed rising channel pattern breakdown | index is trading below the lower band of the pattern. The consecutive bearish candles have given a bullish failure | The sentiments have shifted towards bears. A closing above 35,500 levels will neglect the bearish pattern and a sell-off below 33,000 will trigger more bearishness till 32,000 levels |
Realty Index
Nifty Realty Index formed a tall bullish candle on the monthly time frame
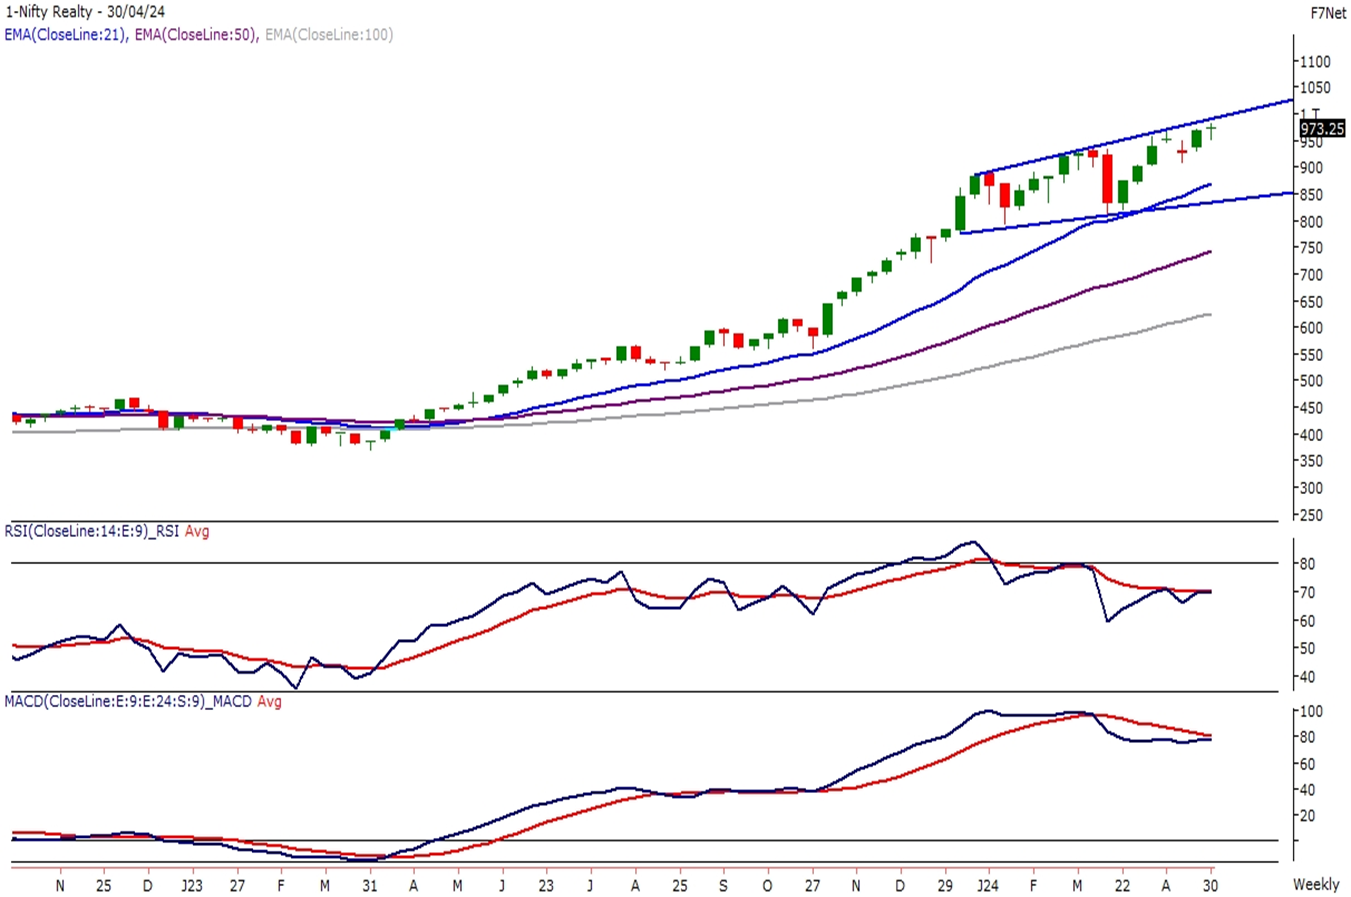
NIFTY REALTY INDEX has gained more than 6 percent gains for April and has formed a tall bullish candle on the monthly time frame. The Index is trading in a Broadening triangle formation on the weekly scale.
The Realty Index has taken support near the lower base of the pattern at the start of the month and reversed with a bullish harami pattern set up on the weekly scale. Presently the index has reached near the upper band of the broadening pattern and prices are retesting their resistance levels on the weekly time frame.
The view remains Buy On dips where prices continuously rank above 21 EMA on the weekly scale. A dip near 900 levels will allow traders to enter long in the index with support near 820 levels. Similarly, a move above 1,000 levels will initiate a breakout in the Index.
Auto Index
NIFTY AUTO Index is indicating a perfect bullish trend is unfolding
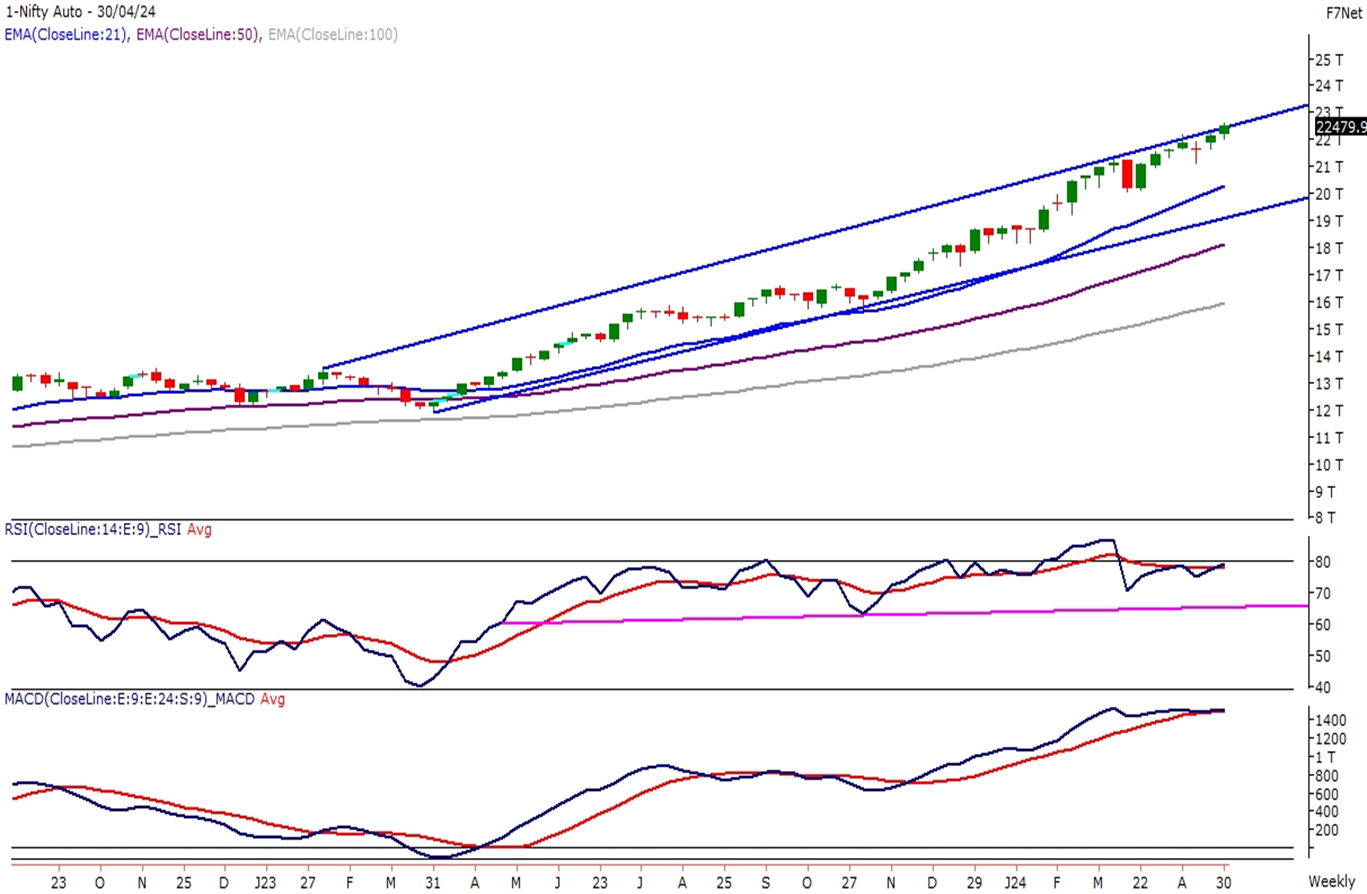
The AUTO Index is trading in a higher high higher low formation within the rising channel pattern indicating a perfect bullish trend is unfolding.
The momentum oscillator RSI (14) is reading in a bullish range shift between 60 – 90 levels on the weekly scale. The MACD indicator is reading above its polarity levels on the weekly time frame. Presently the index has reached near the upper band of the rising channel pattern and prices are retesting their resistance levels on the weekly time frame.
The view remains Buy On dips where prices continuously rank above 21 EMA on the weekly scale. A dip near 21,000 levels will allow traders to enter long in the Auto index with support near 20,000 levels. Similarly, a move above 22,200 levels will initiate a breakout in the Index for the higher levels to 23,500 levels.