
Sectoral Technical Outlook (1/2)
| Index Name | Trend | Pattern/Formation | Strategy |
| Realty | Realty Index for the month of July closed flat | Index is moving in a downward pattern | Buying on dips is advised, with near-term support around the 1040 and 980 levels and resistance around the 1160 and 1200 levels |
| Auto | Index Closed positive for the eighth consecutive month, gained over 6%. Reached new all-time high of 26,758, forming a bullish candle | MACD shows upward momentum, Index showing positive momentum | Buy during declines, support at 22,000 levels, resistance at 27,000 and 27,500 after holding levels above 26,000. |
| Industrial | Index gained about 4% in July, remained over 16,000 levels | RSI forms a symmetrical triangle, above all significant EMAs, weekly EMA as support, MACD rising | Support at around 15,000 level, possible upside momentum reaching 18,000 once 16,500 level is broken. |
| Capital Goods | Index Gained over 4% in July, peaked at 76,300 | RSI has entered a consolidation phase, support creating a descending triangle formation near the 64 mark | Outlook is still favourable, with immediate support between 68,400 and 77,000. |
| Telecom | Index finished more than 4% higher, forming a bullish candle for July | Index is above all EMAs and all MACDs rising | Index is still viewed as favorable, with potential upside momentum capping at the 3,500 and 3,700 levels, and immediate support at the 3,000 and 2,900 levels. |
| Bankex | Index faced profit booking, fell by over 1.5%. Reached new record high but fell to 57,700 | The index is forming a higher formation and is trading between a rising WEDGE pattern at its all-time high | Index is rising, dip buying needs to go on. The closest short-term support and resistance levels are 56,500 and 55,500, respectively, and 61,000 and 62,500. |
Sectoral Technical Outlook (2/2)
| Index Name | Trend | Pattern/Formation | Strategy |
| Energy | Index gained about 5%, forming a bullish candlestick at all-time high of 44,340 | The index is moving within a rising channel and encountering resistance at the channel’s upper bound | Outlook is favourable and dip buying should be done till the 42,000 level. |
| Healthcare | Index increased by more than 8%, forming a powerful bullish candlestick | The bullish pennant breakout has at last held, and the index is starting to rise | Immediate support level for the Index is at 38,000; if prices break below it, the next level to keep an eye on is 36,500 |
| Materials | Index has witnessed a gain of 1.30%, forming a bullish candle | RSI between 70-50, above all major EMAs, MACD rising, index is witnessing higher high higher low pattern | View remains bullish for the index with buy on buy-on-dip strategy. The immediate support is placed at 7,400 and on the higher side, a move above 7,900 |
| FMCG | Increased by over 9%, marking a new high of 22,860, index continues to rise above the 23,000 mark; the next target is 23,500 | The index displayed a Cup & Handle pattern breakout and held above the 22,000 mark | Dip buying should be initiated up to the levels of 22,000 and 21,500 |
| Consumer Durables | Gained about 4%, forming a bullish candle at a new high of 61,500 | Index is advancing in a higher high pattern formation | Buying the index on declines will be advised. With prompt support at levels 58,800, and 58,300. |
| Information Technology | Increased by 13%, forming a large bullish candle. | Index has created a large bullish candle on the monthly chart | Bullish sentiment has taken hold, with immediate support near the 38,500 level and immediate resistance at 42,500 and 43500 |
Realty Index
Nifty Realty index has developed a small DOJI candlestick structure.
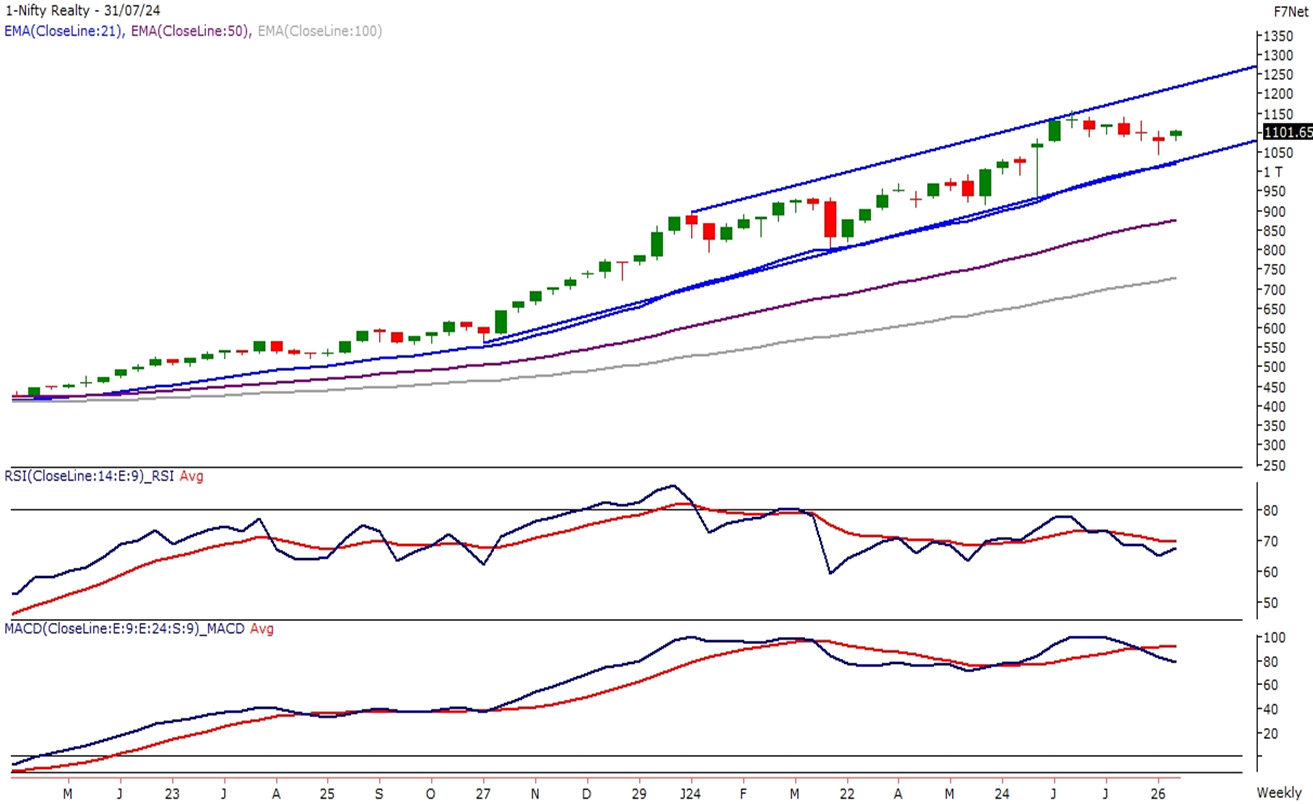
The Realty Index for the month of July closed flat, near the lower band of the rising channel on the weekly chart. On a monthly basis, the index has developed a small DOJI candlestick structure. The index is moving in a downward pattern and is experiencing some profit booking from 52-week high levels following a strong upswing.
The index has been finding support between the 10 and 20 EMA on a weekly timeframe since it took support close to the 1040 mark and maintained above it. The index is showing positive momentum as it is above all significant moving averages on all major time frames. The overbought zone of the momentum indicator, RSI (14) has risen over 88 levels, confirming the general bullish momentum. The RSI is creating a higher low on a weekly timeframe, which is consistent with the index’s overall higher low structure. The MACD is above its polarity and is still rising, which supports the general bullishness.
Overall, the outlook is still optimistic; buying on dips is advised, with near-term support around the 1040 and 980 levels and resistance around the 1160 and 1200 levels.
Auto Index
NIFTY AUTO index reached a new all time high of 26,758 forming a bullish candle
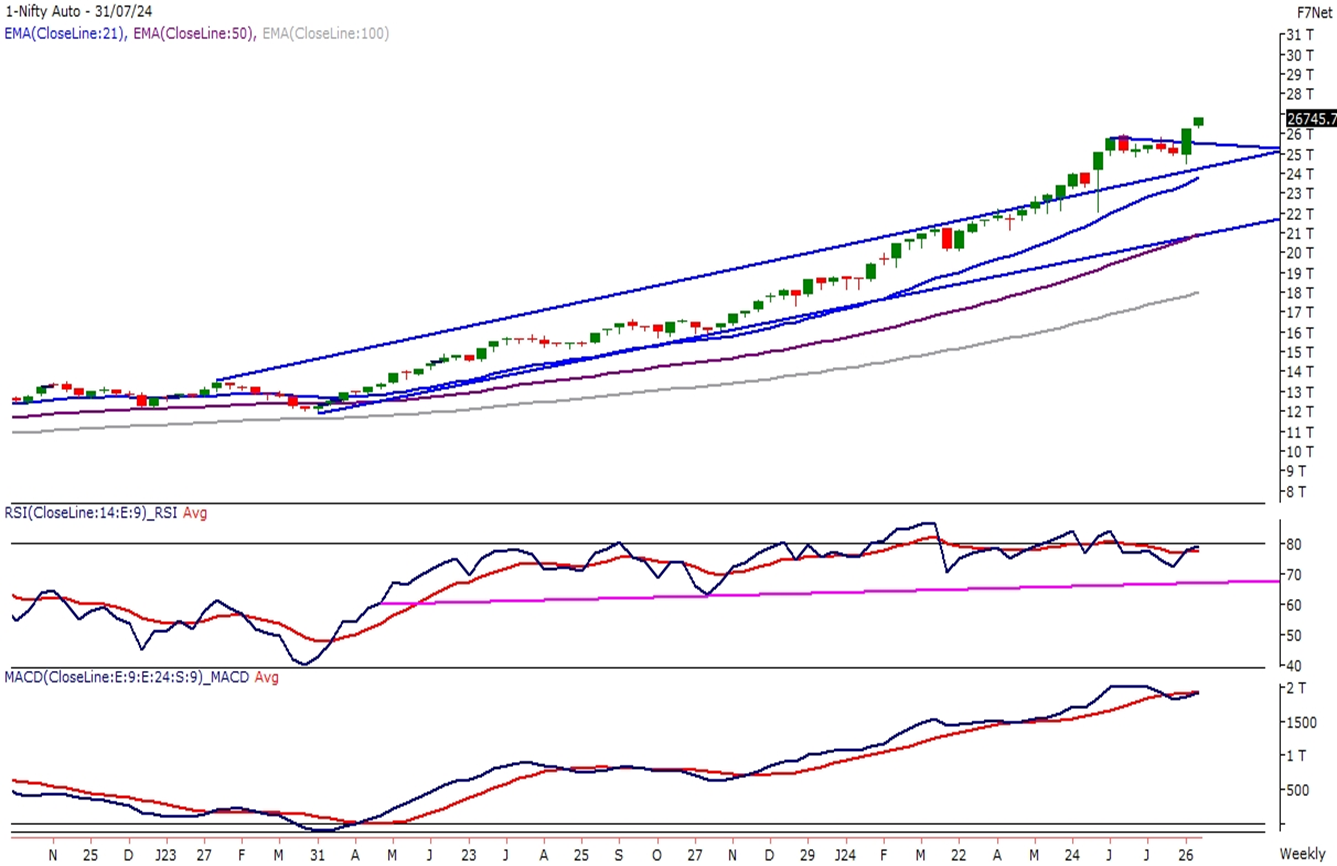
For the eighth consecutive month, NIFTY AUTO has closed positive. For the month of July, the index gained more than 6%. The index reached a new all-time high of 26,758 forming a bullish candle. The index has been trending upward and has formed higher highs and lower lows; the weekly chart’s support at the 10-EMA confirms the generally optimistic outlook.
The momentum indicator, RSI (14) on a monthly time frame, has broken through horizontal resistance and rise above the 90 mark. The MACD indicator is above its polarity and is rising, supporting the generally positive trend in the index. On a weekly basis, the index has been finding support at the 10 and 20 EMA. The index is showing positive momentum as it is above all significant moving averages on all major time frames.
The advice is still to buy during declines when prices consistently sustain over the weekly 10 EMA. The Auto index long with support at 22,000 levels will be accessible during a slide towards the 25,000 level. The Index will also move from 27,000 and 27500 levels after holding levels above 26,000.
Industrial Index
INDUSTRIAL Index ended 4% higher than the previous month
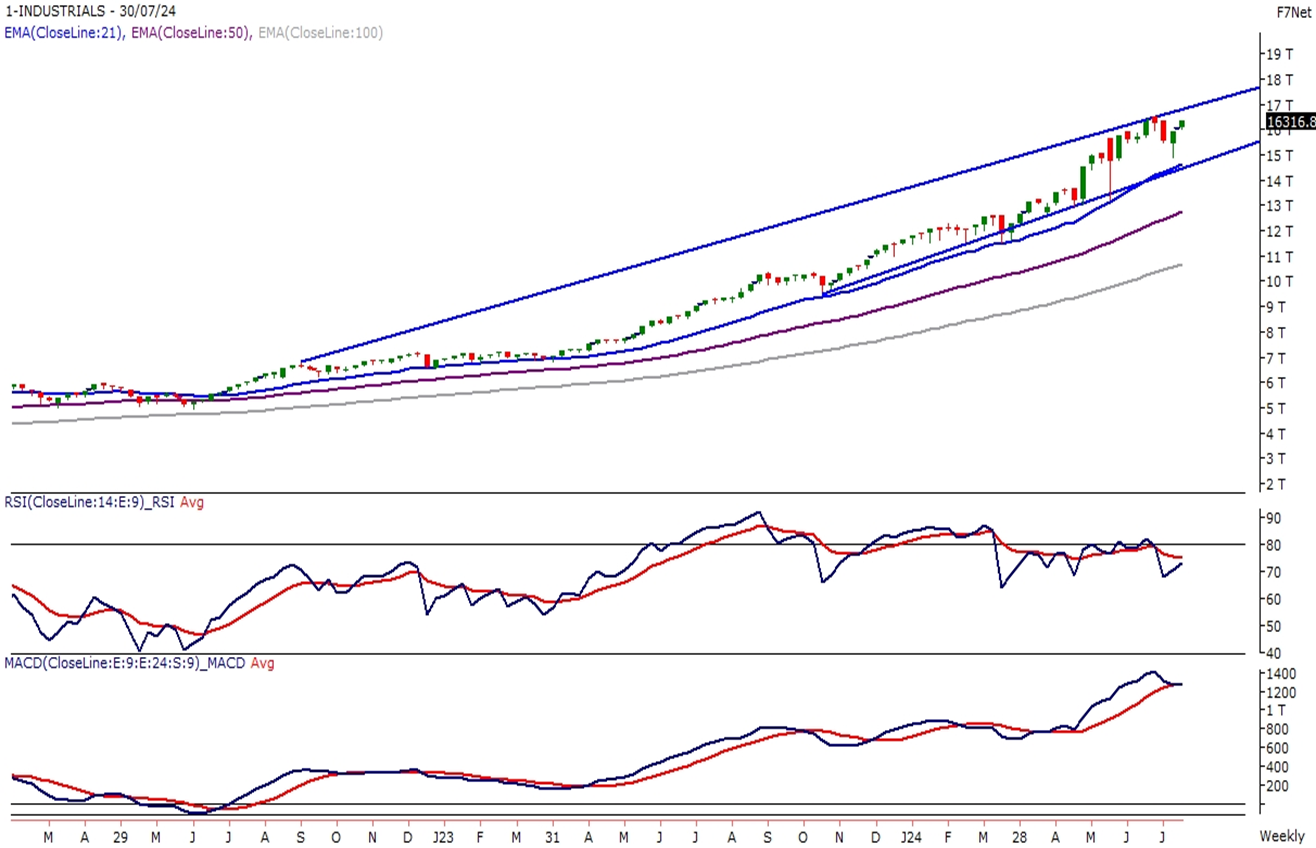
The Industrial Index ended the month about 4% higher for the July month. After the volatility of the previous month, the index remained over 16,000 levels. The index fell from the upper band of the rising channel over the first few weeks of the month, but there was a swift buying from the 14,900 level, which is close to the 20 EMA, which is acting as support on the weekly chart. The index’s increased high-low structure validates the general upward trend.
The rising trend line has provided support for the momentum indicator RSI (14) as it has established a symmetrical triangular formation. The fact that the index is above all significant Exponential Moving Averages (EMA) supports the trend, and the weekly 20 EMA has been a reliable level of support. The MACD is continuing to rise above its polarity.
With possible upside momentum reaching 18,000 once the 16,500 level is broken, the Industrial Index is still considered favourable. Immediate support is at around the 15,000 level.