
Sectoral Technical Outlook (1/2)
| Index Name | Trend | Pattern/Formation | Strategy |
| Realty | Index has gained more than 2 percent gains for June 2024 | Indicating a lack of upward momentum | Index’s next support level is 1,000, and its immediate resistance level is 1,200; a break over this level is probably going to take it to 1,300 |
| Auto | Index has gained for seven months running and is currently heading quite bullishly | the Higher Low Higher High formation is still ongoing | recommendation is still Buy during declines in which prices consistently move above the weekly 10 EMA |
| Industrial | has gained another 5.50% in June, continuing the extremely bullish momentum | Index has formed a strong bullish candle on the monthly time frame | Industrial Index is still seen as being positive, with immediate support located around 14,400 and 13,900 levels |
| Capital Goods | Index achieved a record high of 70,000 levels and created another large bullish candle on a monthly timeframe | Index forms a higher high – higher low structure | Outlook for the counter is still favorable; on a weekly timeframe, we could witness a mean reversion to the 10 and 20 EMA. |
| Telecom | The index was able to gain 10% from its monthly low | A distinct higher-high higher-low pattern was seen on the weekly time frame, and the index recently showed a breakout of the one-month consolidation | Index is still seen as being positive, with immediate support located around 2,800 and 2,700 levels, with potential upside momentum capping close to 3,250 levels |
| Bankex | Index on the weekly chart has given a rising wedge pattern breakout and prices are trading above the upper band of the range | The index is forming a higher low formation and is trading between a rising WEDGE pattern at its all-time high | The immediate support for the Banking Index is placed below the trend line which is placed at 56,600 and resistance is likely to be capped near 62,000 levels. |
Sectoral Technical Outlook (2/2)
| Index Name | Trend | Pattern/Formation | Strategy |
| Energy | On the monthly timeframe, a large DOJI candle has formed near the highs of the NIFTY ENERGY index, signaling a halt to the upward | Index broke out of the rectangle formation at all-time highs | Outlook is still optimistic, and dip buying should be started up to 38,500 levels |
| Healthcare | Index on the weekly chart is trading in a triangle pattern and recently prices have witnessed a breakout | Index is trading in a higher high higher low formation and has presently witnessed a smaller degree trend line breakout | We will be partially long at current levels and will wait for a dip will 36,000 levels, with immediate support near 35,000 levels |
| Materials | Basic Material Index has witnessed a breakout of a triangle pattern on the weekly time frame | Post-breakout prices are sustaining above the upper band of the bullish pattern | We will be partially long at current levels and will wait for a dip will 7,400 levels, with immediate support near 7,200 levels. |
| FMCG | Index on the weekly chart is trading in a higher high higher bottom formation within the rising channel pattern | Index has witnessed a horizontal trend line breakout and prices are trading above their short-term resistance levels | We will be partially long at current levels and will wait for a dip will 20,000 levels, with immediate support near 19,500 levels. |
| Consumer Durables | Durables Index on the weekly chart is trading in a rising channel pattern | Index is trading in a higher high higher low formation and has presently witnessed a smaller degree trend line breakout on the daily chart | We will be partially long at current levels and will wait for a dip will 58,000 levels, with immediate support near 57,000 levels. |
| Information Technology | Index has witnessed a breakout of a downward slanting trend line on the weekly chart | Prices are sustained above the same indicating a strength in the breakout. | Technically the IT Index is trading in a bullish terrain and buying on present levels can be initiated and on dips near 35,500 with immediate support of 35,000 – 34,500 levels |
Realty Index
Nifty Realty index was quite positive on a monthly time frame
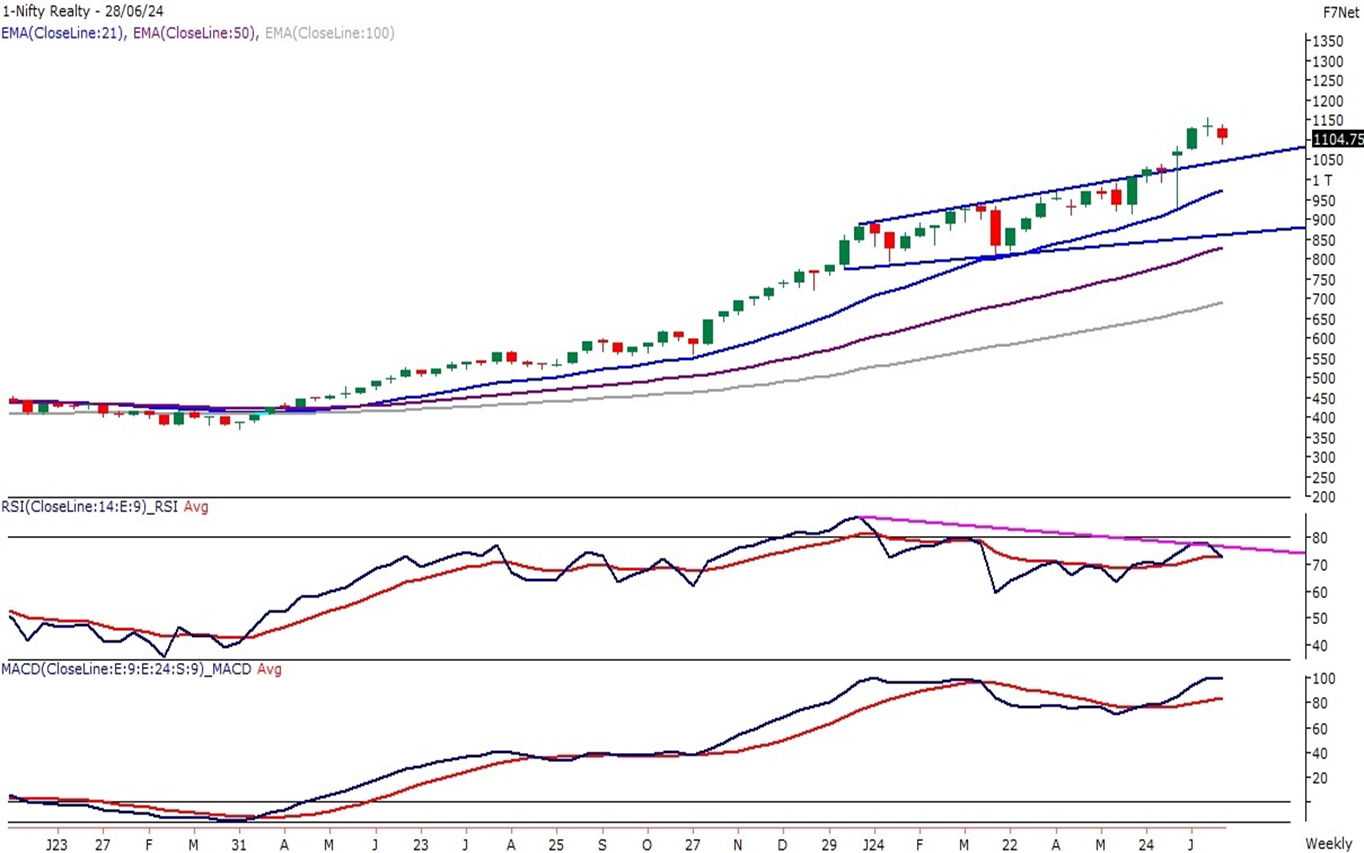
At its 52-week high levels, the NIFTY REALTY INDEX has gained more than 2 percent for June. The index was quite positive on a monthly time frame, and the DOJI structure presently suggests that, at least for the time being, an equilibrium has been reached.
Since the third week of June, the Realty Index has been trading above the 900–980 level consolidation zone. The weekly time frame’s 10–20 EMA zone may see some mean reversion in the index due to the Bearish evening star pattern, which suggests a little pullback in the upcoming month. Indicating a lack of upward momentum, the weekly time-frame RSI bearish divergence is currently reverting from the over-bought zone to the normal zone.
The index’s next support level is 1,000, and its immediate resistance level is 1,200; a break over this level is probably going to take it to 1,300.
Auto Index
NIFTY AUTO index can take a little decline and retest the 22,950 prior breakthrough level
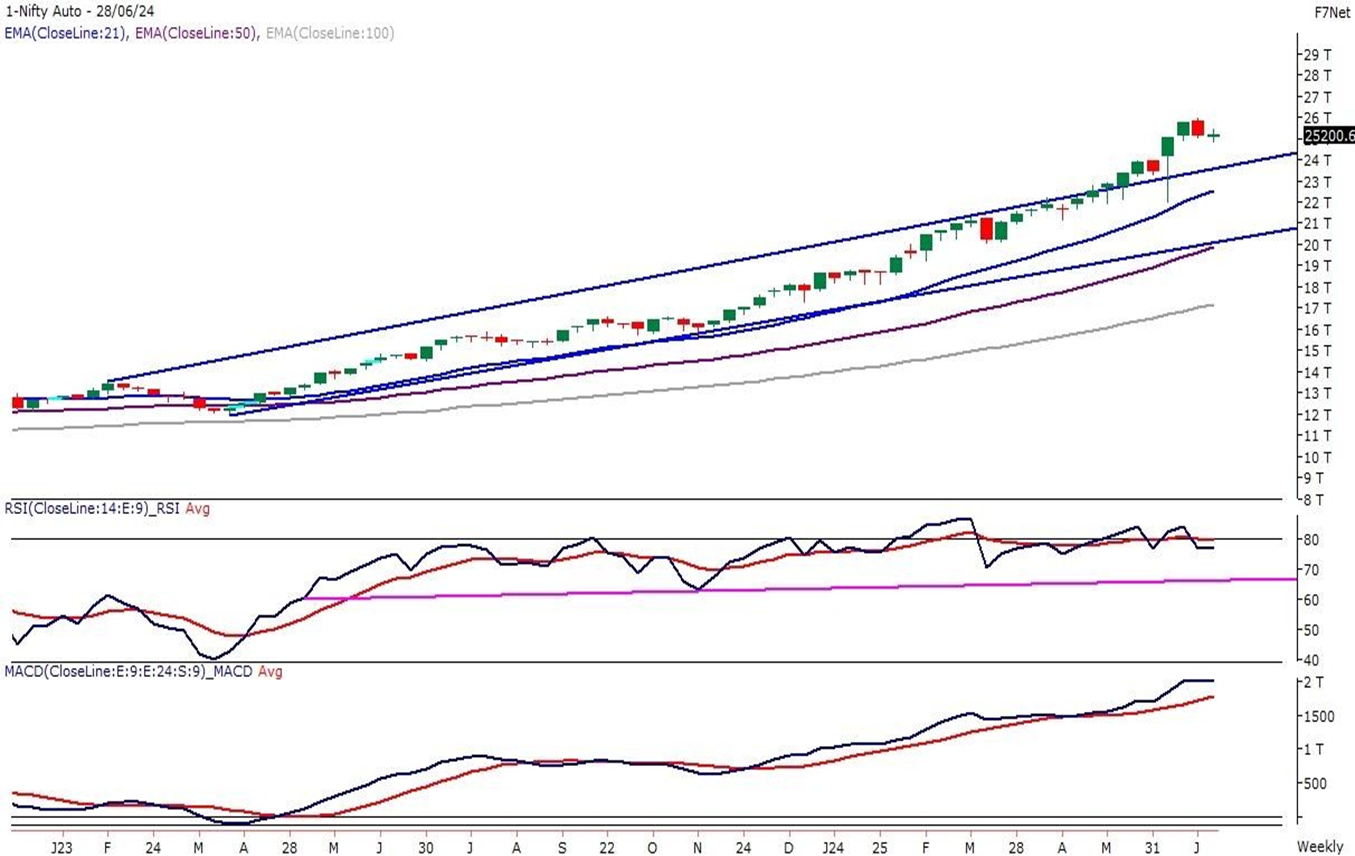
The AUTO Index has gained for seven months running and is currently heading quite bullishly. In May, it increased by more than 5%.
For the first time in a monthly timeframe, the momentum oscillator RSI (14) reached 86 levels, signifying a very positive index. The weekly timeframe shows that the index is still trading above the 10 EMA and that the Higher Low Higher High formation is still ongoing. In the next month, the index can take a little decline and retest the 22,950 prior breakthrough level.
The recommendation is still Buy during declines in which prices consistently move above the weekly 10 EMA. With support at 24,000 levels, a drop near 23,000 levels will enable traders to go long in the Auto index. In a similar vein, the Index will begin to break out to 27,000 levels if it moves over 26,000 levels.
Industrial Index
INDUSTRIAL Index is still seen as being positive, with immediate support located around 14,400 and 13,900 levels
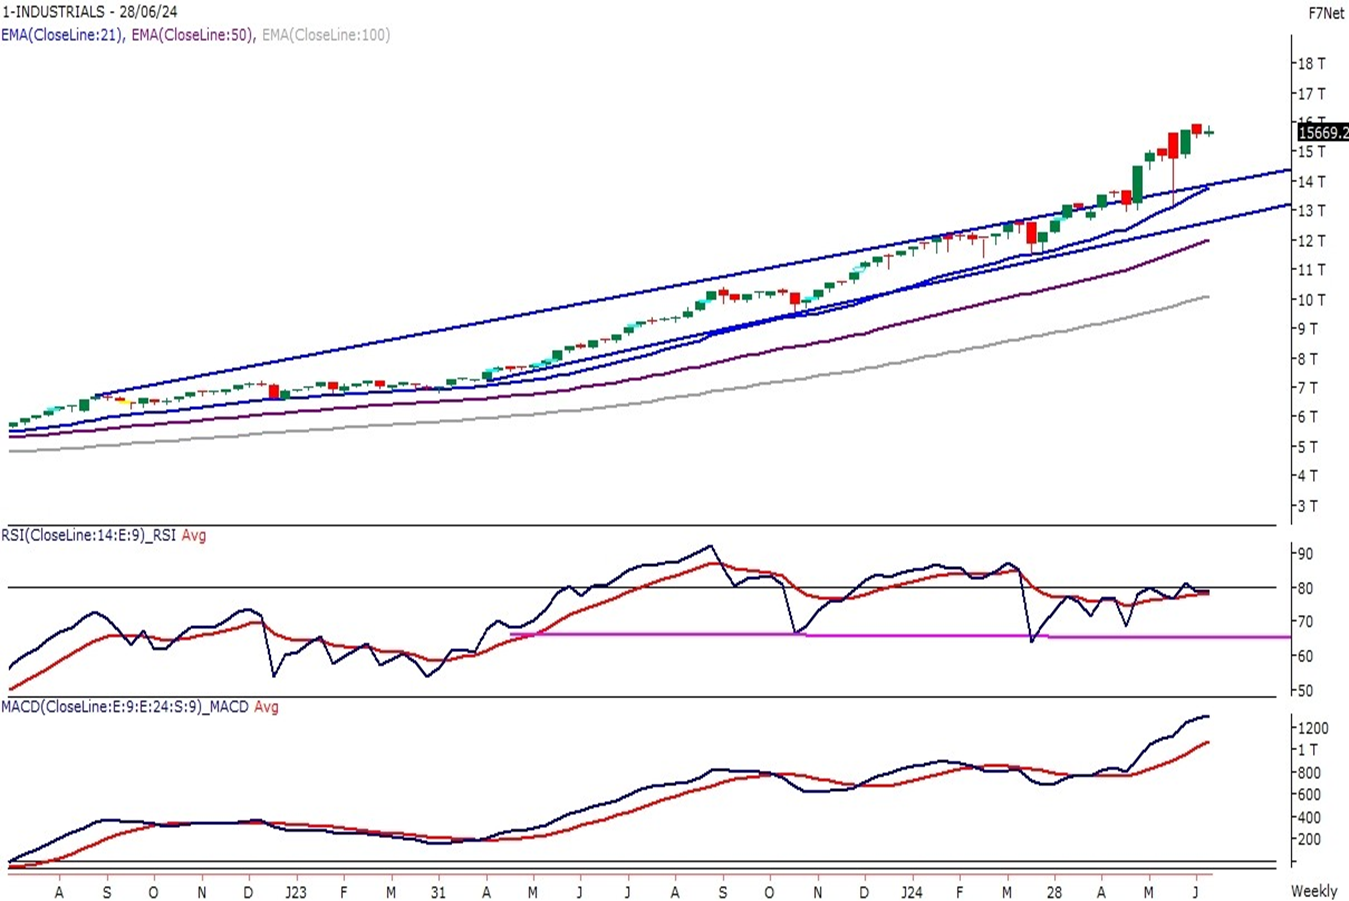
INDUSTRIAL INDEX has gained another 5.50% in June, continuing the extremely bullish momentum. The index has risen for the 7th consecutive month and has gained more than 50% through this period. The index has formed a strong bullish candle on the monthly time frame.
The index has been trading over 10 & 20 EMA on the weekly time frame and these moving averages are working as a good support zone. Index is making a higher-high higher-low pattern on a weekly timeframe. RSI is taking support near 65 levels and is in an over-bought zone, indicating the bullish momentum to continue till RSI remains above 60 levels.
The Industrial Index is still seen as being positive, with immediate support located around 14,400 and 13,900 levels, with potential upside momentum till 16,500 levels once the 15,900 level is breached.