Sector Summary At Glance
| Index Name | Pattern Formation | Strategy | View |
| Realty | Trend is bullish to sideways | Buy-on-dips is advisable as long as prices remain above the support zone. | Bullish to sideways |
| Auto | Short-Term Bearish Outlook with Key Support Levels | Buy on Dips | Negative trend shift in the short
term |
| Industrial | Sideways trend expected to continue in the short term | Buy on breakout above resistance or near support if confirmed. | Sideways trend |
| Capital Goods | The index is consolidating with key levels acting as a decision zone | Breakdown below 65,000 for directional clarity | Consolidation phase |
| Telecom | Index remains in a bearish to sideways zone | Wait-and-watch approach advised | Wait and Watch |
| Bankex | Sideways trading range | The price action suggests a wait-and-watch approach
until the index breaks out of this consolidation phase |
Breakout or breakdown for
direction |
| Energy | Signs of Reversal at Critical Support | Bearish trend visible with a potential reversal above resistance. | Bearish |
| Healthcare | Index shows bullish momentum | Shows bullish momentum, with support and potential breakout targets | Bullish outlook |
| Basic Material | Index Broadening triangle pattern. | Avoid immediate positions as the index is trading near
critical support levels |
Wait and Watch |
| FMCG | Index is bearish but may stabilize near support | Bullish confirmation only above 21,500. | Monitor the index near support levels |
| Consumer Durables | Bullish Momentum Builds | Target 68,000 – 70,000 for potential gains. | Bullish outlook |
| IT | Bullish Breakout with Strong Upside Potential | Add positions on dips during consolidation phases. | Bullish trend |
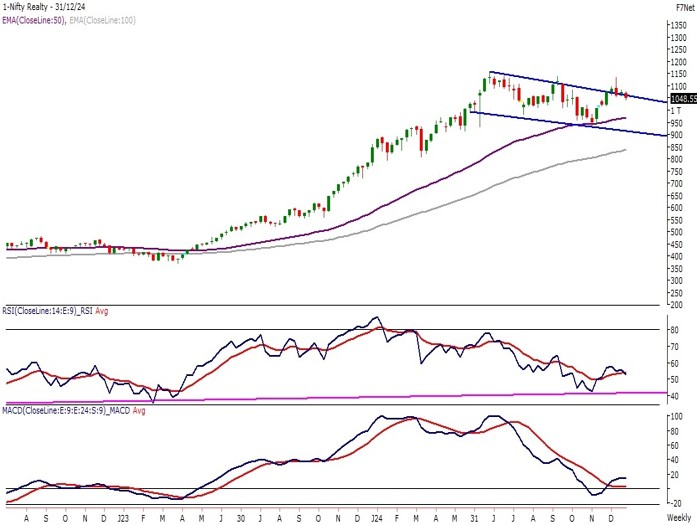
Realty: Buy-on-dips is advisable as long as prices remain above the support zone

Trend Formation
Formed a hammer candlestick pattern on the monthly chart. Gained over 2.20% in December, showing positive momentum.
Weekly Analysis
Trading within a slanting channel pattern for the past 7 months. Currently near the upper band of the channel.
Momentum Indicators
RSI (14): Has found support near 40 and is moving towards 60,
indicating improving strength.
Key Levels
Support: 950 (near the lower band of the channel and 50 EMA at 966).
Resistance: Immediate resistance at 1,150; breakout above this
level could target 1,250–1,300.
Trend is bullish to sideways. Buy-on-dips is advisable as long as prices remain above the support zone.
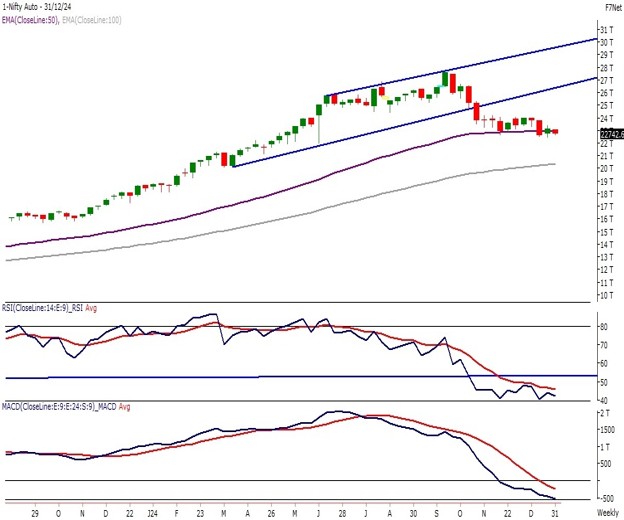
Auto: Negative trend shift in the short term.

Trend Formation
Bearish movement continued for the third consecutive month. Prices
traded in a bearish to sideways mode, indicating a time correction.
Weekly Analysis
Witnessed a breakdown of a bearish rising channel pattern. Prices are sustaining below the breakdown level, confirming a bearish outlook for the short term.
Momentum Indicators
While analyzing trends on the broader time frame the index is likely to find support near its medium-term averages (50 and 100 EMA) 22,940 and 20,300 respectively.
Key Levels
Support: 22,000 and 21,500
Resistance: 25,000
Entry recommended on dips near support levels, with cautious monitoring of key resistance for a potential breakout.
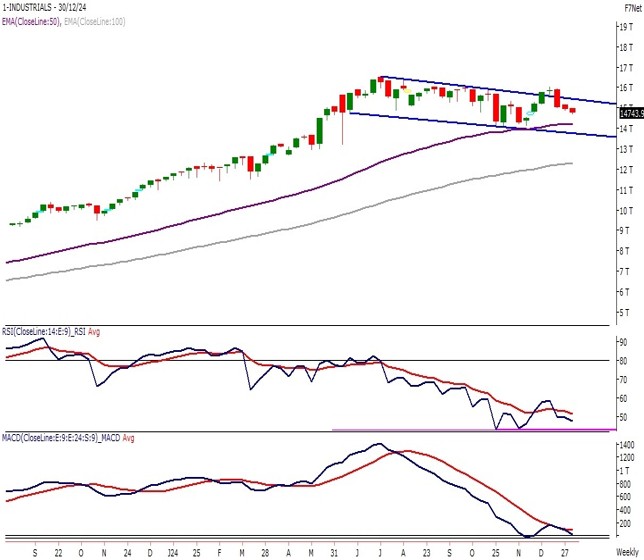
Industrial: Sideways trend expected to continue in the short term

Trend Formation
Another sideways trading month with prices confined to the previous month’s range. Failed bullish breakout as prices drifted below resistance levels and stayed within the channel.
Monthly chart
Time correction evident, with prices trading in a narrow range for the past 4–5 months. Monthly chart indicates indecision and consolidation within a defined range.
Momentum Indicators
The major support for the Industrial index occurs near its 50 EMA which is placed at 14,200 levels and is clubbed with the lower band of the channel pattern.
Key Levels Support: 14,200
Resistance: 16,000
Trade execution advised only after a clear breakout above 16,000 or a breakdown below 14,000 – 13,700.
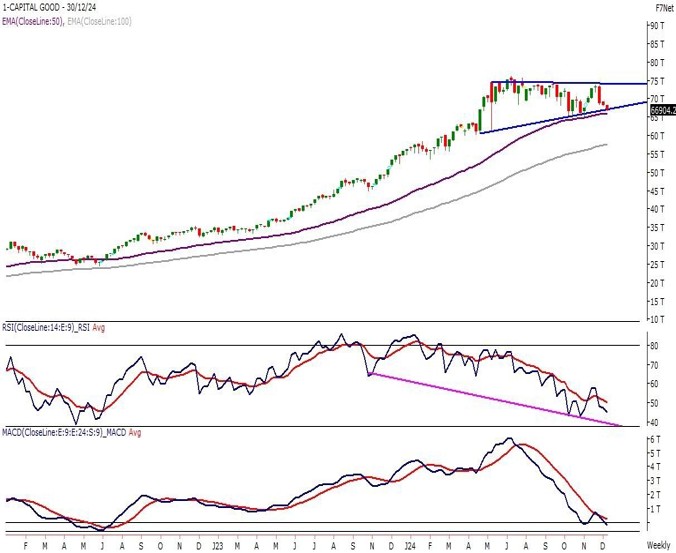
Capital Goods: The index is consolidating with key levels acting as a decision zone

Trend Formation
The Capital Goods Index remained volatile within its four-month range, ending with a 4% monthly loss and forming a shooting star candlestick near trendline resistance.
Weekly Analysis
Recently the prices have taken support near its 50 EMA which is placed at 65,000 levels on the weekly chart. The EMA support is clubbed with the lower band of the triangle pattern formation on the weekly chart.
Momentum Indicators
The Capital Good Index has also formed a Tweezer Bottom candle stick pattern on the monthly chart. And the low of the candle stick pattern will act as a support for the index.
Key Levels
Support: 66,000 – 65,000
Resistance: 75,000
Trade execution advised after a clear breakout above 75,000 or a breakdown below 65,000 for directional clarity.


