Sectoral Technical Outlook (1/2)
| Index Name | Trend | Pattern/Formation | Strategy |
| Realty | Perceptual bullish trend | Multiyear rectangle pattern breakout | Partial long at current levels, another half at dip near 700 levels |
| Auto | Rising wedge pattern breakout | Higher high higher low formation | Partial long at current levels, wait for dip to 17,800, support near 17,300, breakout above 18,600 targets 19,000 |
| Industrial | Bullish breakout of horizontal flag pattern | Drift in RSI after top near 90, support near 80 | Partial long at current levels, wait for dip to 11,000, support near 10,500, upside capped below 12,100 – 12,250 |
| Capital Goods | Bullish breakout of horizontal flag pattern | Drift in RSI after top near 85, support near 65 | Partial long at current levels, wait for dip to 52,500, support near 51,300, upside capped below 56,000 – 56,500 |
| Telecom | Rectangle pattern breakout | Lower low in RSI, bullish hidden divergence | Partial long at current levels, wait for dip to 2,130, support near 2,050, breakout above 2,230 targets 2,400 – 2,450 |
| Bankex | Rising channel pattern | Support near 21 WEMA, moving higher | Going long at current stage, target 55,500 – 55,700, support at 52,500 – 51,500 |
Sectoral Technical Outlook (2/2)
| Index Name | Trend | Pattern/Formation | Strategy |
| Energy | Higher high higher bottom, inverted head & shoulder pattern | Golden crossover, RSI near 80 | Half positional at current levels, another half at dip near 32,500, downside protected at 31,500 – 31,000 |
| Healthcare | Rectangle pattern breakout | Drift in RSI, bullish crossover | Partial long at current levels, wait for dip to 30,500, support near 29,500, upside target near 31,700 – 32,000 |
| Materials | Higher high higher bottom formation | Bullish ascending triangle pattern breakout | Going long at current stage for 6,800 – 6,900 levels, support at 6,300 – 6,150 |
| FMCG | Higher high higher bottom formation within rising channel | Horizontal trend line breakout, trading above short-term resistance | Partial long at current levels, wait for dip to 19,900, support near 19,500, target 20,600 – 21,000 |
| Consumer Durables | Higher high formation, triangle pattern breakout | Moving above 21 & 50 EMA, positive for the index | Buying on present levels, initiate on dips near 49,000, support at 48,000 – 47,500, target 51,000 – 51,500 |
| Information Technology | Breakout of rectangle pattern, sustained above | Above 21 & 50 EMA, RSI support near 50, bullish crossover | Buying on present levels, initiate on dips near 34,800, support at 34,000 – 33,500, target 37,000 – 37,500 |
Realty Index
Bullish momentum: nifty realty index signals strong outperformance and breakout potential
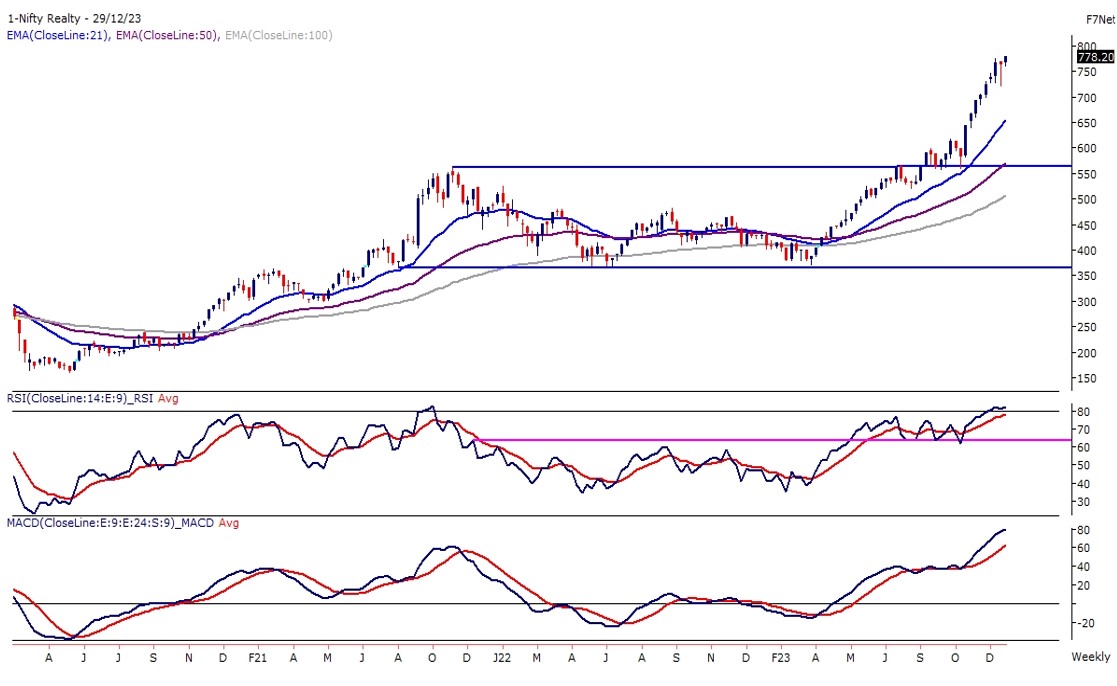
- The Realty index has been consistently forming higher highs over the past few months, signalling a perceptible bullish trend. With a remarkable return of over 27% in the last 10 weeks, the index has outperformed the Benchmark index.
- NIFTY REALTY INDEX experienced a breakout from a multiyear rectangle pattern on the monthly timeframe, and it continues its upward trajectory with strong momentum. Trading above the 21, 50, and 100 Weekly Exponential Moving Averages (WEMA), and with the RSI (14) in a bullish range shift mode on the weekly scale, the index shows robust technical strength.
- An effective strategy would be to buy on dips following the bullish breakout, anticipating a potential throwback on the broader time trend as the oscillator approaches the overbought zone. Consider initiating half a position at current levels and the remaining half on a dip near 700 levels, setting downside protection at 660 levels and capping the upside below 810 – 830.
Auto Index
Breakout signals strong momentum with 13% returns in 10 weeks
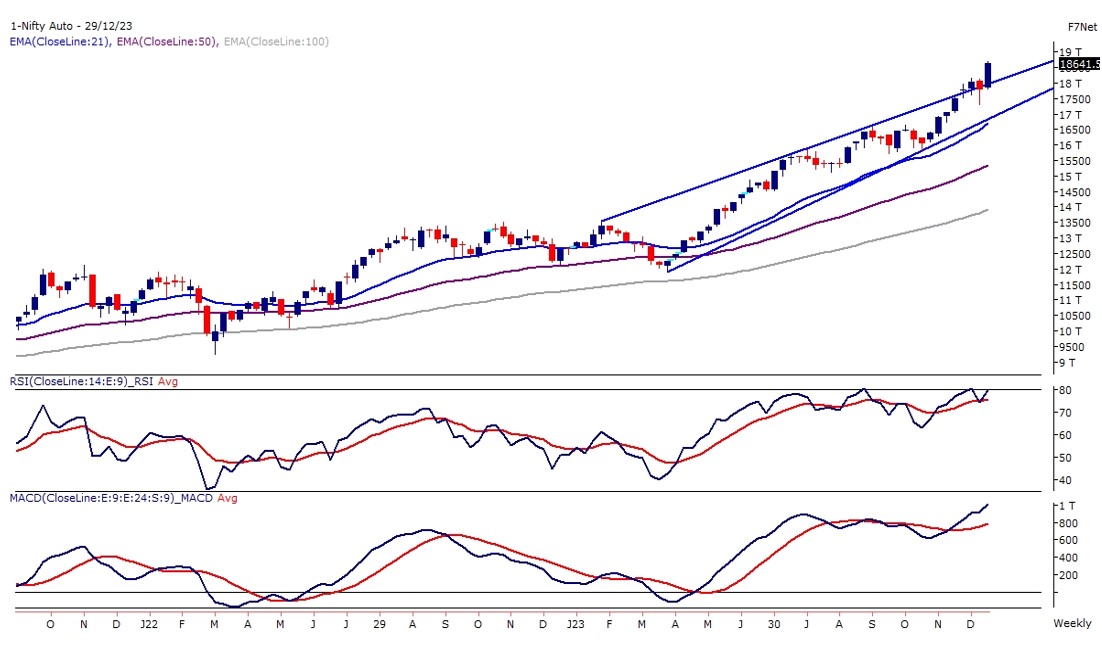
- On the weekly chart, the NIFTY AUTO Index is in a rising wedge pattern, experiencing a recent breakout above its trend line, resulting in over 13% returns in just 10 weeks.
- With a higher high and higher low formation, the index shows a smaller degree trend line breakout on the daily chart. The RSI (14) has re-entered the overbought zone near 80 levels with a bullish crossover.
- We’re considering a partial long position at current levels, waiting for a dip around 17,800, supported by immediate levels around 17,300. A breakout above 18,600 would set the next target near 19,000 levels.