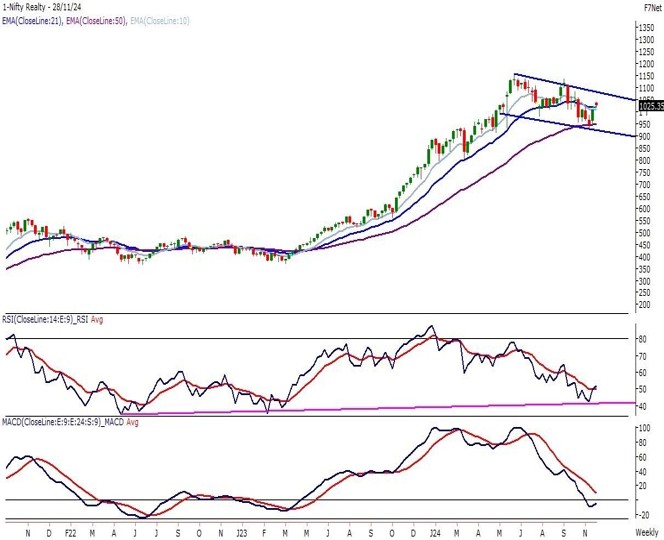
Realty: Shows a reversal pattern with a hammer candlestick

Trend Formation
The Nifty Realty Index traded within the previous month’s range, forming a hammer candlestick on the monthly chart, signaling a potential reversal. It closed over 2% higher.
Weekly Analysis
On the weekly chart, Prices are in a falling channel pattern, recently rebounding from the lower band, which aligns with the 50 EMA support near 948 levels.
Momentum Indicators
The major support for the Realty index occurs near its 50 EMA which is placed at 948 levels and is clubbed with the lower band of the channel pattern.
Key Levels
Support: 950 and 930
Resistance: 1,100
Wait for a move beyond 1,100 (bullish) or below 930 (bearish) for clarity in the trend direction.
Auto: Short-Term Bearish Outlook with Key Support Levels

Trend Formation
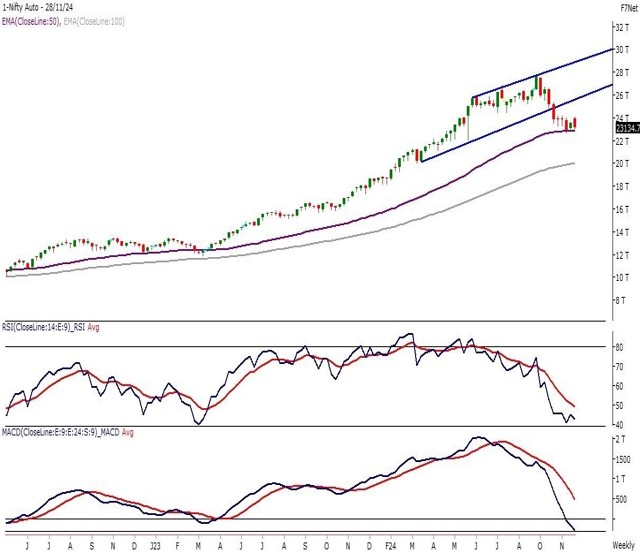
Nifty Auto Index is in a profit-taking mode as the prices have closed with cuts for the second consecutive month and lost more than 1.30% on the monthly chart.
Weekly Analysis
The Auto index in its previous month has formed a bearish belt hold line candle stick pattern near all-time high levels and similarly on the weekly chart prices have witnessed a rising channel pattern breakdown.
Momentum Indicators
RSI (14): The momentum oscillator RSI (14) on the monthly chart is still reading above 60 levels which suggests support at lower levels.
MACD: Bearish crossover but the indicator is still above its line of polarity
which indicates early selling.
Key Levels
Support: 22,000 and 22,800
Resistance: 25,000
One should wait for the Auto index to enter on dips near 22,800
and 22,000 levels as prices are indicating a negative shift in the trend
Industrial: Consolidation with Reversal Signals Awaiting a Breakout

Trend Formation
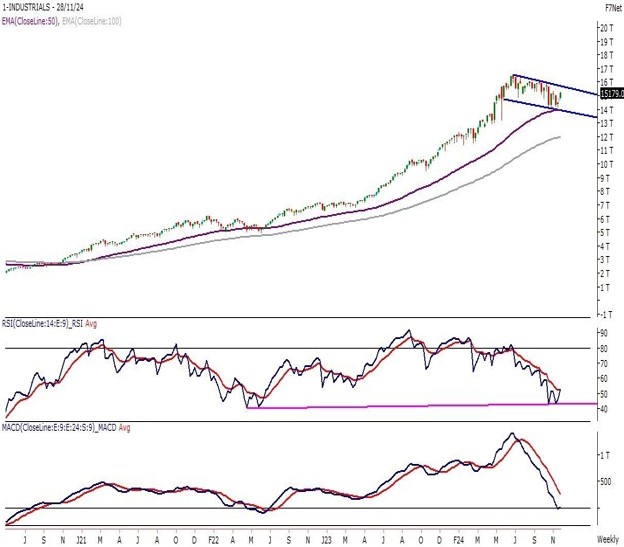
The Nifty Industrial Index closed 1.10% higher, forming a Dragonfly Doji on the monthly chart, signaling a potential reversal after a sideways month.
Weekly Analysis
On the weekly time frame, the Industrial index is trading in a falling channel pattern and recently prices have taken support near the lower band of the pattern and witnessed a reversal from the lower levels.
Momentum Indicators
The major support for the Industrial index occurs near its 50 EMA which is placed at 14,000 levels and is clubbed with the lower band of the channel pattern.
Key Levels
Support: 14,000 – 13,800
Resistance: 15,900
Resistance is at 15,900 for a bullish breakout; support at 14,000– 13,800 for a bearish breakdown. Wait for a range break before trading.
Capital Goods: A Bullish Setup Amidst Volatility

Trend Formation
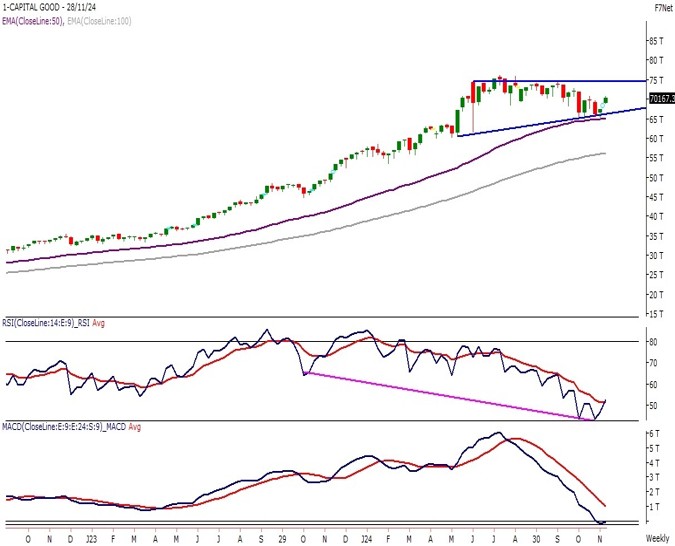
The Capital Goods Index gained 1.50%, forming a hammer candlestick near trendline support, amid high volatility within a four-month range.
Weekly Analysis
Prices recently found support near the 50 EMA, aligning with the lower band of a triangle pattern on the weekly chart.
Momentum Indicators
The Capital Goods Index formed a Tweezer Bottom on the monthly chart, signaling a potential bullish reversal with matching lows after a downtrend.
Key Levels
Support: 66,000 – 64,800
Resistance: 74,000
The Capital Good Index has also formed a Tweezer Bottom candle stick pattern on the monthly chart.


