Daily Snippets
Date: 31st October 2023 |
|
|
Technical Overview – Nifty 50 |
|
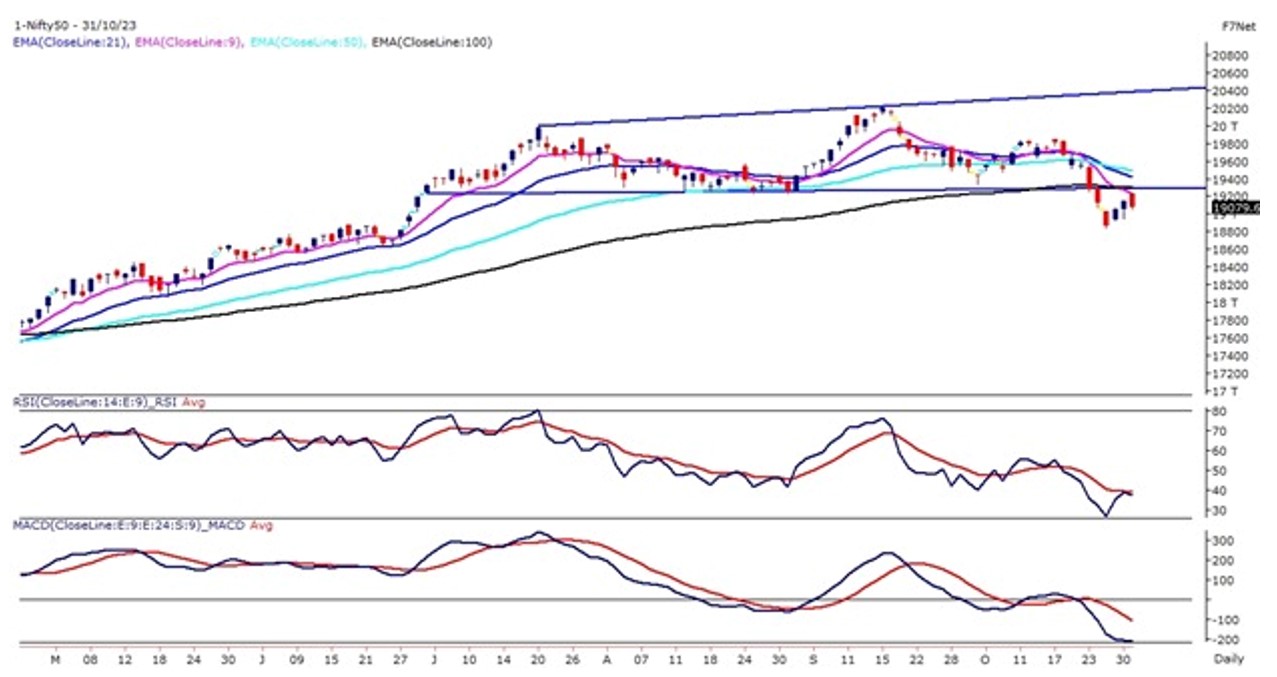
The benchmark Index on 31st October witnessed a gap-up opening following the global peers but the index couldn’t hold on to its opening gains and drifted lower within minutes and traded near 19,100 levels for the majority of the time.
The Nifty50 opened near its 9 EMA and faced strong resistance near 19,250 levels. The prices on the 30-minute chart are trading in a higher high higher low formation which indicates a strong support near its immediate low which is placed at 19,050 levels.
On the monthly chart, the index closed with a loss of more than 2.50%, and in terms of candle stick from the last four months, the index is trading in a narrow range between 19,200 and 19,800 levels. The index on the daily chart has almost completed its pullback of the bearish breakdown.
Looking ahead, Nifty is likely to trade below its immediate resistance of 19,300 levels, and in case the index breaks above the said levels a sharp move toward 19,500 levels cannot be ruled out. On the lower side, the support for the index is placed at 19,000 – 18,900 levels.
|
Technical Overview – Bank Nifty |
|
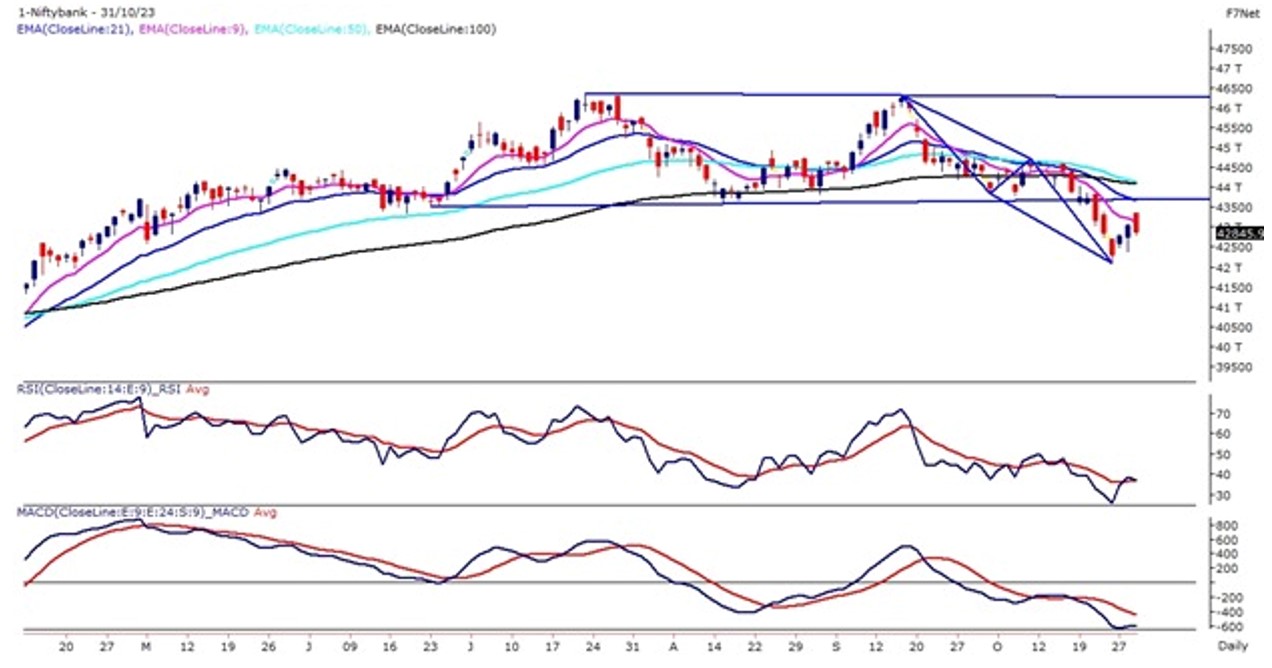
The Banking Index on 31st October, couldn’t hold on to its opening gains and moved lower and traded with a bearish bias throughout the day. In terms of candle stick the banking index has formed a dark cloud cover bearish reversal pattern on the daily time frame.
On the monthly chart, the Banking index has drifted below its previous four-month low and closed with a loss of close to 4% on the monthly time frame. On the weekly chart, the Banking Index is trading in a rising wedge pattern and prices are trading near the lower band of the pattern. The prices are hovering near its 50 WEMA which is placed at 42,800 levels and is likely to act as an important pivot level.
On the daily chart the prices witnessed a gap up opening but faced a strong resistance near its 9 EMA which is placed at 43,150 levels. Looking ahead, Bank Nifty is likely to trade below its immediate resistance of 43,500 levels, and in case the index breaks above the said levels a sharp move toward 43,800 levels cannot be ruled out. On the lower side, the support for the index is placed at 42,400 – 42,200 levels.
|
Indian markets:
- The domestic stock market experienced a turbulent session on Tuesday, marked by widespread selling pressure across most sectors, leading to a decline in benchmark indices.
- Despite an initial positive momentum, the indices quickly reversed course, continuing their downward trajectory.
- The negative trend was influenced by weak cues from Asian markets and a significant sell-off in banking, auto, and IT stocks.
- Continuous selling by foreign institutional investors added to the pressure on local markets in recent weeks.
- Notably, the Nifty encountered resistance in the 19,160-19,220 range, resulting in a closing with a negative bias.
- In the broader market, there was increased demand for realty, media, and consumer durables shares.
|
Global Markets
- The Dow Jones index futures were up 130 points, indicating a positive opening in the US stocks today.
- Markets in Europe advanced as inflation across the euro zone dropped to a two-year low of 2.9% in October, according to preliminary data released on Tuesday, down from 4.3% the previous month. Core inflation, which excludes volatile food and energy prices, dropped to 4.2% year on year in October from 4.5% in September.
- French GDP grew 0.1% on the quarter, data showed earlier Tuesday, showing annual growth of 0.7%, while German retail sales slumped 0.8% on the month in September, an annual drop of 4.3%.
- Asian stocks ended mixed on Tuesday as sentiment was hit by weaker than expected Chinese purchasing managers? indices. China?s official manufacturing purchasing managers index fell to 49.5 in October from 50.2, dipping back below the 50-point level demarcating contraction from expansion
|
Stocks in Spotlight
- Pidilite Industries experienced a significant surge, rising by 6.3 percent to reach a day’s high of Rs 2,450. This increase followed an upgrade from global brokerage firm Goldman Sachs, which shifted its rating on the stock from ‘sell’ to ‘buy.’ Goldman Sachs also shared an optimistic target price of Rs 2,725 per share. The positive momentum came as a result of Pidilite Industries overcoming its earnings downgrade cycle. Additionally, new growth opportunities are emerging for the company, positioning India’s largest manufacturer of adhesives on a promising trajectory.
- DLF shares rose by over 1.52 percent following the company’s fiscal second-quarter earnings report that surpassed market expectations. The company reported a significant 31 percent year-on-year increase in net profit, reaching Rs 622 crore. Additionally, revenue from operations saw a slight uptick to Rs 1,476 crore, surpassing projected figures. This positive performance contributed to the rise in DLF shares, reflecting investor confidence in the company’s financial strength and growth prospects.
- Private equity firm CVC Capital has initiated a deal to sell its controlling stake in Healthcare Global, the leading cancer-care hospital chain in the country. This move propelled the company’s shares up by over 4 percent to Rs 375 on the NSE by 12:55 pm on October 31. The report revealed that other major private equity firms including KKR, BPEA EQT, and Manipal Hospitals are in discussions for a potential buyout. CVC Capital is aiming to sell its 60.42 percent stake for a sum exceeding Rs 4,000 crore. An investment bank has also been appointed to provide advisory services for the deal.
|
News from the IPO world🌐
- ESAF IPO to open on 3rd November
- IPO bound OYO’s loss declines 34% to Rs.1,287 crore in FY23
- Weak start for Mamaearth’s IPO, 12% subscribed on Day 1
|
|
Day Leader Board
Nifty 50 Top Gainers | Stock | Change (%) | | SBILIFE | ▲ 3.3 | | TITAN | ▲ 2.5 | | HDFCLIFE | ▲ 2.2 | | ASIANPAINT | ▲ 1.1 | | KOTAKBANK |
▲ 1.1 |
| Nifty 50 Top Losers | Stock | Change (%) | | SUNPHARMA | ▼ -2.7 | | M&M | ▼ -2.3 | | EICHERMOT | ▼ -1.8 | | LTIM | ▼ -1.7 | | ONGC | ▼ -1.5 |
| |
Sectoral Performance | Top Sectors | Day change (%) | | NIFTY REALTY | 1.27 | | NIFTY MEDIA | 0.91 | | NIFTY CONSUMER DURABLES | 0.61 | | NIFTY FMCG | 0.16 | | NIFTY PSU BANK | 0.14 |
|
Advance Decline Ratio | Advance/Declines | Day change (%) | | Advances | 1836 | | Declines | 1798 | | Unchanged | 126 |
|
Numbers to track | Indices Name | Latest | % 1D | % YTD | | Dow Jones (US) | 32,929 | 1.6 % | (0.6) % | | 10 Year Gsec India | 7.4 | -0.20% | 0.50% | | WTI Crude (USD/bbl) | 82 | (3.8) % | 7.0 % | | Gold (INR/10g) | 60,952 | 0.00% | 11.20% | | USD/INR | 83.39 | 0.2 % | 0.9 % |
|
|
Please visit www.fisdom.com for a standard disclaimer.
|
