
Overview: Adani Group X Hindenburg Research
The US short seller firm Hindenburg Research has published a 106-page report on the Adani group. The firm has outlined issues of suspected fraud at the Adani group & has highlighted a detailed concern around the brazen stock manipulation & accounting fraud. Even though Adani has released a detailed “413-page” response, the Hindenburg has clarified that the Adani group has failed to answer 62 out of 88 questions raised by them specifically.
Let’s have a look at the timeline of all these events to understand it better :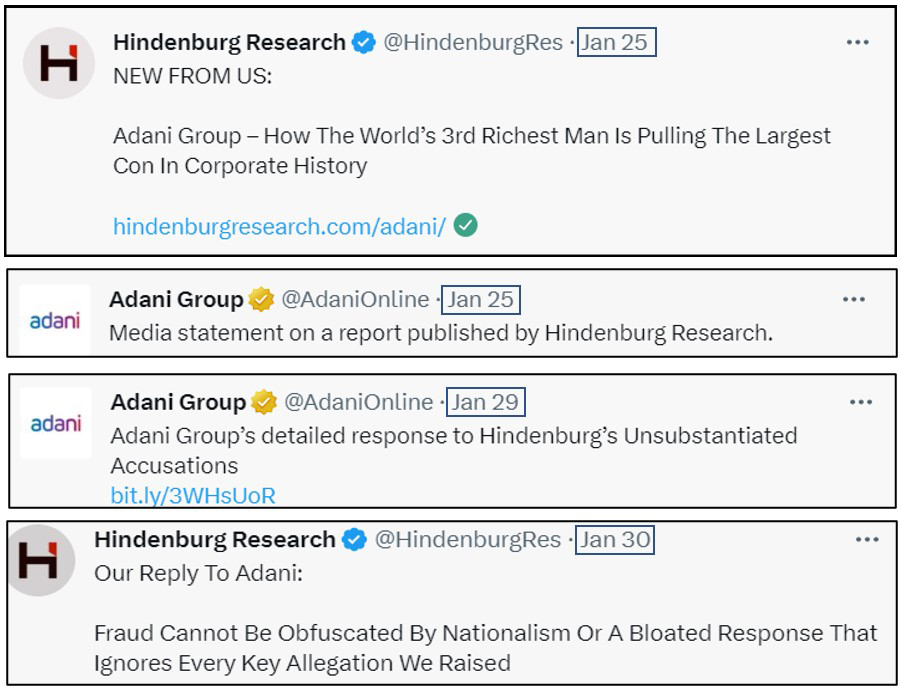
Investors were cautious and responded negatively post the event. The sentiments worsened after global lenders Credit Suisse and Citi Group assigned zero lending value to notes issued by the group firms. The following data reflects the same.
| Company Name | Before Hindenburg Report | After Hindenburg Report |
| 01 Jan’22 – 31 Dec’22 | 25-Jan-23 To 02-Feb-23 | |
| Adani Total Gas Ltd. | 115.50% | -53.30% |
| Adani Green Energy Ltd. | 45.50% | -44.10% |
| Adani Enterprises Ltd. | 125.80% | -53.80% |
| Adani Transmission Ltd. | 49.50% | -38.00% |
| Adani Ports and Special Economic Zone Ltd. | 11.90% | -35.20% |
| Ambuja Cements Ltd. | 38.80% | -23.40% |
| Adani Wilmar Ltd. | 62.00% | -22.60% |
| Adani Power Ltd. | 200.10% | -22.60% |
| ACC Ltd. | 10.10% | -14.80% |
| Nifty 50 | 4.30% | -1.50% |
Source: ACE MF, Fisdom Research
After this massive fall in share prices, on 2nd February 2023, Adani Enterprises called off the fully subscribed FPO to protect the investor’s interest. It is also expected that the group companies to see volatility going ahead.
Will it have any impact on your mutual fund portfolio? Does your mutual fund hold Adani group companies in the portfolio?
Mutual fund industry-level exposure to Adani group companies
Despite the bull run that Adani stocks have seen in the last year, most of the mutual fund houses stayed away from the group companies. It was mainly because of the elevated valuations.
| Mutual Fund Holding As a % of Total Net AUM As of December’22 | |||
| All Schemes | Active Schemes | Passive Schemes | |
| Adani Enterprises Ltd. | 0.12% | 0.04% | 0.08% |
| Adani Green Energy Ltd. | 0.01% | NA* | 0.01% |
| Adani Ports and Special Economic Zone Ltd. | 0.19% | 0.15% | 0.05% |
| Adani Power Ltd. | 0.00% | — | NA* |
| Adani Total Gas Ltd. | 0.01% | NA* | 0.01% |
| Adani Transmission Ltd. | 0.01% | NA* | 0.01% |
| Adani Wilmar Ltd. | 0.00% | — | NA* |
| ACC Ltd. | 0.08% | 0.08% | 0.01% |
| Ambuja Cements Ltd. | 0.20% | 0.19% | 0.01% |
| Total | 0.64% | 0.46% | 0.18% |
Source: AMFI, BSE, Fisdom Research. Portfolio data as of Dec’22 has been considered. *Less than 0.001%. All primary open ended & close ended schemes with regular growth option have been considered for the computation.
As of Dec’22, the mutual fund has a negligible exposure of 0.64% to Adani group companies. Of which 0.18% was through the passive route, where the fund manager has no option but to invest in the stocks.
Adani Enterprises Ltd. & Adani Ports and Special Economic Zone Ltd. Forms a part of the Nifty 50 buckets with an overall weightage close to 1%. Along with these two stocks, Adani Transmission Ltd and Adani Green Energy Ltd form a part of the nifty 100 buckets with an overall weightage of 2.1%.
There are more than 100 passive schemes & more than 200 active schemes with an investment in Adani group stocks.
| Active Funds Contribution as A % of Total Investments Made in Adani Group Stocks | Passive Funds Contribution as A % of Total Investments Made in Adani Group Stocks |
| 71.60% | 28.40% |
Source: ACE MF, Fisdom Research. Portfolio data as of Dec’22 has been considered. All primary open-ended & close-ended schemes with regular growth options have been considered for the computation.


