AUM Study
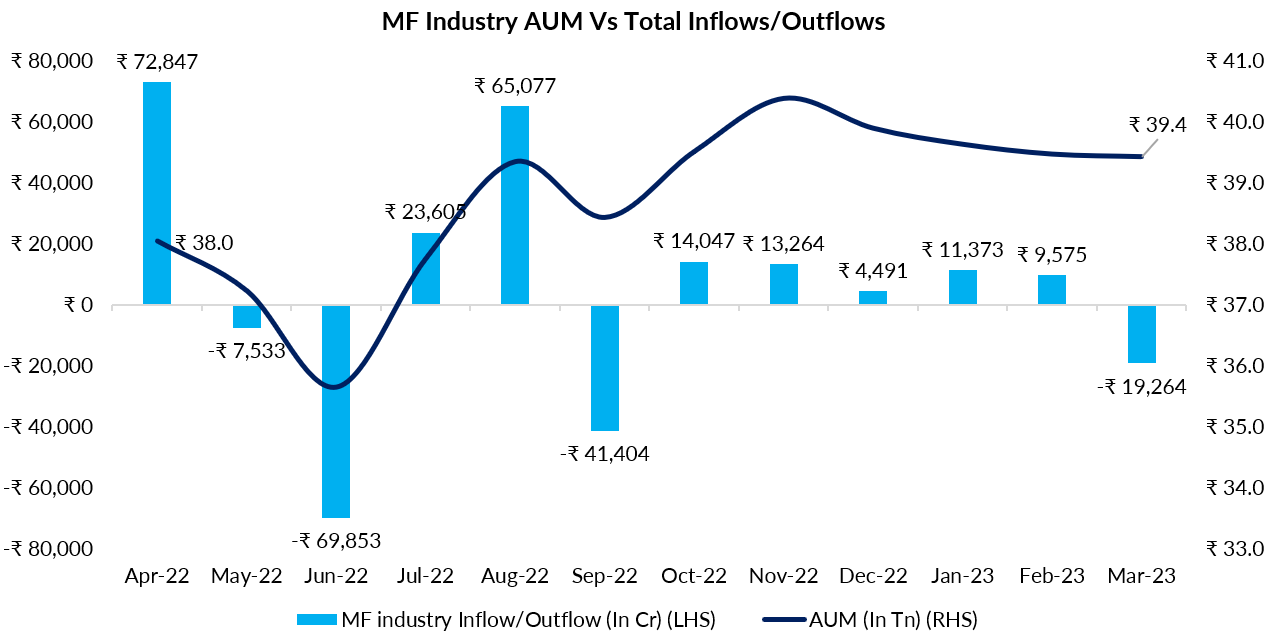
Mutual Fund Industry AUM grew by 5% in FY 23; Inflows remain almost flat

| Year | AUM (INR Cr) | AUM % Change | Inflow/(Outflow) (In Cr) | Folio count (In Cr) |
| FY20 | ₹ 22,26,203 | -6.4% | ₹ 86,989 | 9.0 |
| FY21 | ₹ 31,42,764 | 41.2% | ₹ 2,14,743 | 9.8 |
| FY22 | ₹ 37,56,683 | 19.5% | ₹ 2,46,591 | 13.0 |
| FY23 | ₹ 39,42,031 | 4.9% | ₹ 465 | 14.6 |
The mutual fund industry in India has been on a growth trajectory for several years, and FY23 was no exception. Despite facing various challenges such as the Russia-Ukraine war, elevated inflation levels, and geopolitical tensions, the industry’s net assets under management (AUM) grew by 5 percent, reaching an impressive ₹39.4 trillion. While there was a slight dip of 0.1 percent in AUM on a month-on-month basis in March 2023, the average industry AUM has remained above the ₹40 trillion mark.
The modest increase in AUM during FY23 can largely be attributed to almost flat inflows of Rs. 465 crore during the fiscal year. However, the growing investor base is reflected in the impressive pace of folio growth, which stood at 14.6 percent.
Despite the challenges faced during FY23, the industry’s growth is a testament to its resilience and the trust of investors in the mutual fund route.
AUM Study
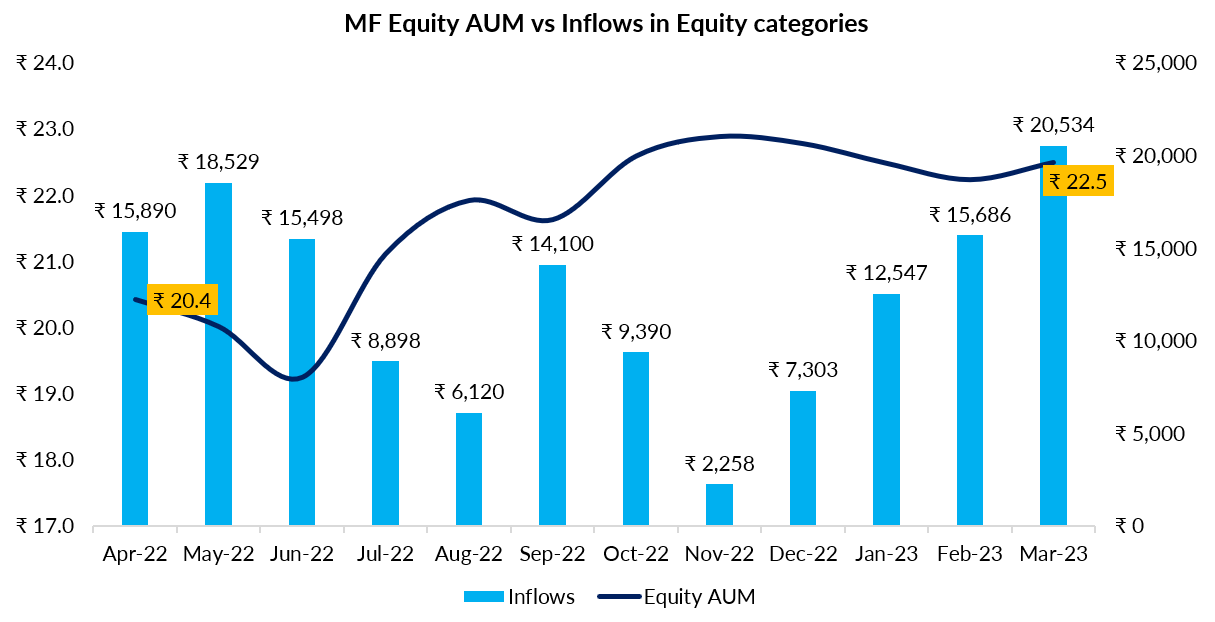
Equity AUM grew by 10% in FY 23; Inflows remain resilient

| Year | AUM (In Crores) | % Change | Inflows (In Crore) |
| FY20 | ₹ 8,96,701 | -17.3% | ₹ 83,787 |
| FY21 | ₹ 14,79,603 | 65.0% | -₹ 25,966 |
| FY22 | ₹ 20,44,784 | 38.2% | ₹ 1,64,399 |
| FY23 | ₹ 22,48,910 | 10.0% | ₹ 1,46,754 |
The Indian equity market has shown impressive growth in recent years, with Equity AUM more than doubling in the past three years. In FY23, Equity AUM grew by 10 percent and on a month-on-month basis by 1.17 percent, demonstrating strong resilience despite market volatility.
Despite the Nifty 50 declining by 0.6 percent in FY23, inflows into equity categories totaled Rs. 1.46 lakh crore, with 85 new fund offers launched in various equity categories, signaling investor bullishness on the Indian equity market’s long-term growth prospects. The spike in investors during the post-pandemic period, despite global geopolitical tensions and inflation, is another indication of resilient investors faith in the Indian equity markets.
AUM Study
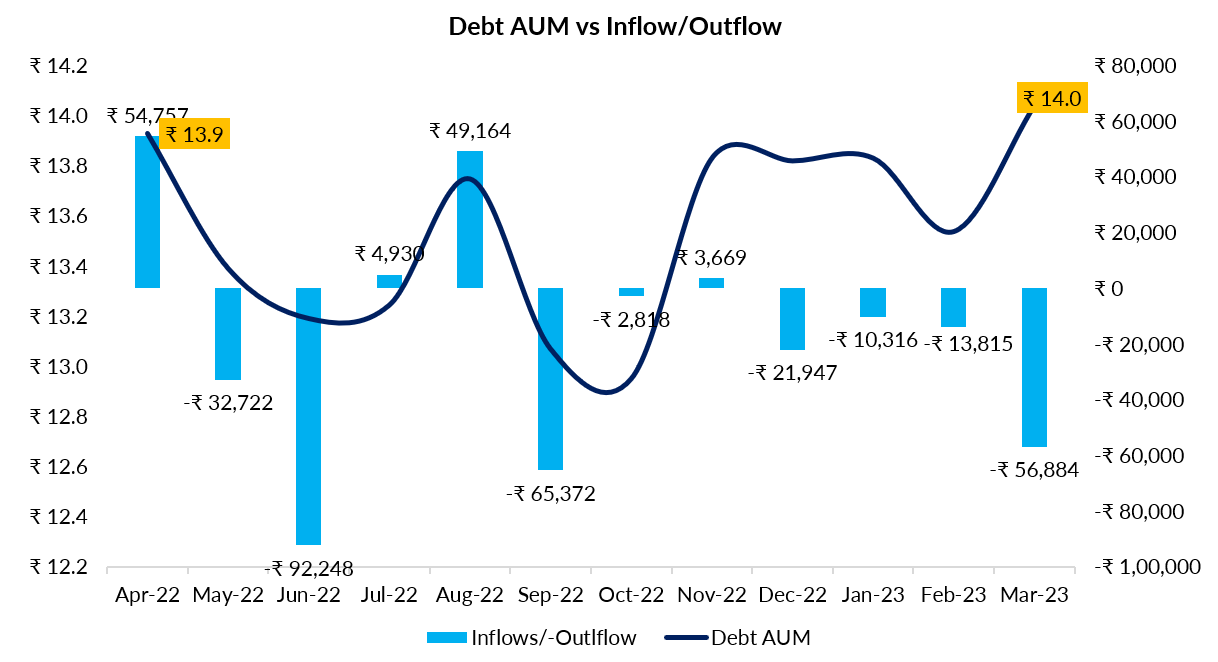
Debt AUM declined by 9% in FY 23; Outflows remain persistent

| Year | AUM (In Cr.) | %Change | Inflows/-Outflows |
| FY20 | ₹ 10,29,142 | -16.0% | -₹ 4,778 |
| FY21 | ₹ 13,28,226 | 29.1% | ₹ 2,30,592 |
| FY22 | ₹ 12,98,961 | -2.2% | -₹ 68,471 |
| FY23 | ₹ 11,81,982 | -9.0% | -₹ 1,83,603 |
The debt assets under management (AUM) in India have been continuously declining for the past two years. In FY23, the AUM fell by 9 percent, but on a month-on-month basis, the Debt AUM increased by 3.7 percent. This was due to strong inflows received at the end of March 2023 following the Finance Ministry’s announcement that the long-term capital gains (LTCG) benefit would no longer be available after April 1, and the indexation benefit would no longer apply to debt funds held for more than three years.
The income/debt-oriented category saw significant net outflows in March, with liquid funds being the hardest hit. The net selling of liquid funds amounted to Rs. 56,924.13 crore. The year FY23 saw mutual funds that focused on investing in fixed-income securities facing challenges due to increasing interest rate cycles and better returns from equity. As a result, the segment experienced a net outflow of Rs. 1.8 lakh crore.
SIP Study
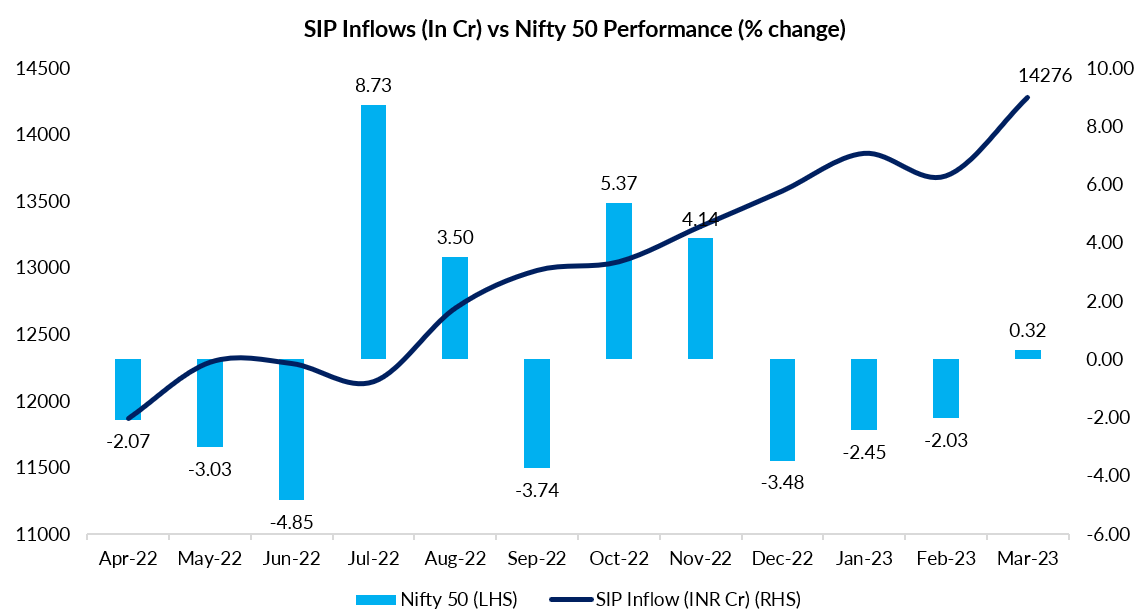
SIP Inflows at new life time high in March 2023


