Daily Snippets
Date: 01st September 2023 |
|
|
Technical Overview – Nifty 50 |
|
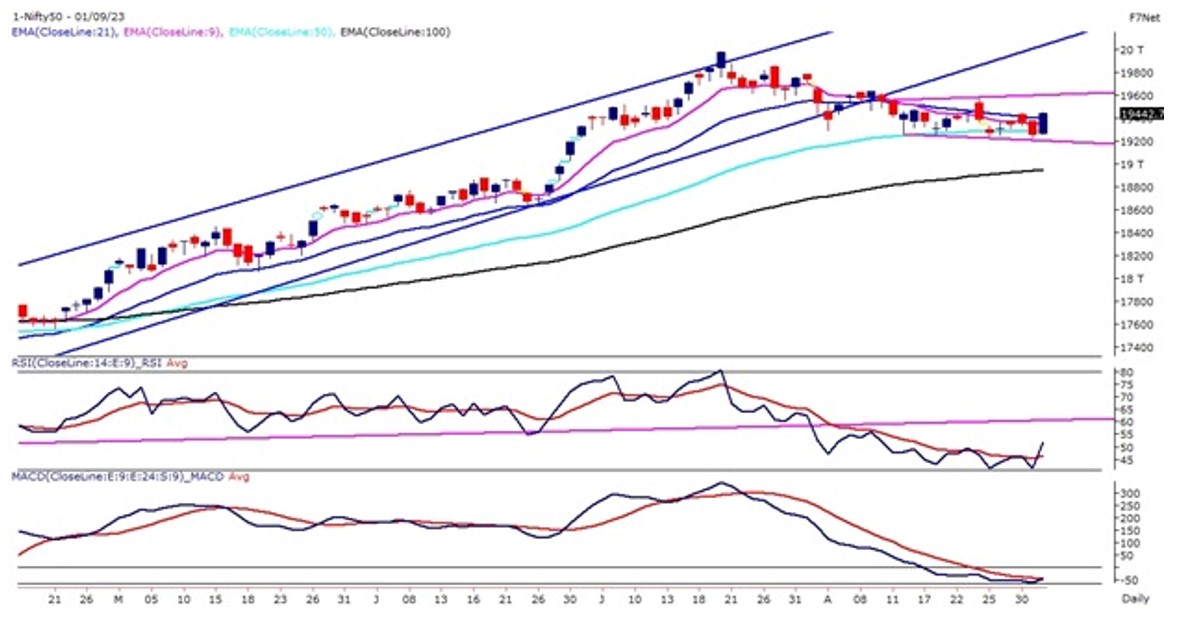
The Nifty50 started with a solid gain for September month and closed above 19,400, mark that was acting as a hurdle for the past few trading sessions. On the weekly chart, the index closed in green after 5 consecutive weeks of negative closing.
The Benchmark index on the daily chart has taken support near the lower band of the rectangle pattern and moved higher thereafter. The sharp move has forced the index to close above its 50 & 21 DEMA. The momentum oscillator RSI (14) has taken support near 40 levels but still hovering near 50 levels.
Nifty futures rollover stood at 77.97%, which is significantly lower compared to last month’s expiry rollover of 83.95% and its three-month average of 79.61%. Nifty will start the September series with an open interest of 1.06 crore shares compared to an OI of 1.33 crore shares at the beginning of the August series.
INDIAVIX, known as the fear indicator, rose 14.75% during the August month series, increasing from 10.51 to 12.06 levels, causing major discomfort to the bulls. Now the immediate hurdle for the bulls will be near 19,600 levels and a breakout above the said levels will initiate a bullish breakout in the index. Similarly, on the lower side, 19,300 & 19,200 will act as immediate support for the index.
|
Technical Overview – Bank Nifty |
|
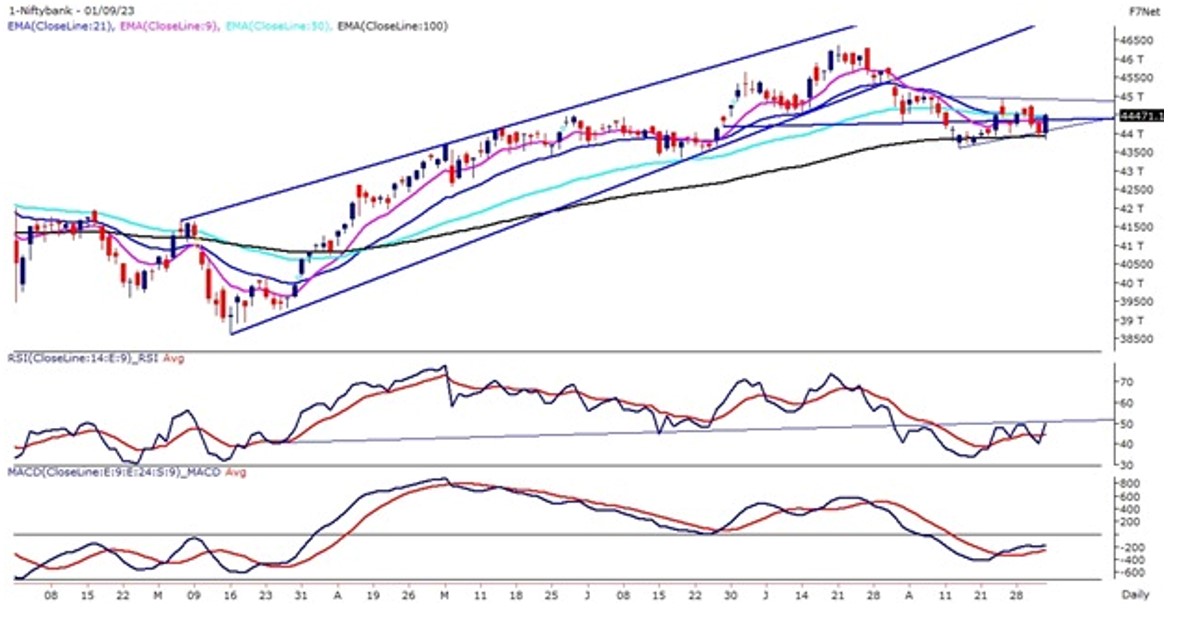
The Bank Nifty on the daily chart witnessed a sharp short covering after two days of fall and prices found support near the lower band of the consolidation band. The Banking index on the weekly chart has formed a spinning top candle stick pattern which indicates a lack of clarity among the traders.
The index on the daily chart is trading within the rectangle pattern and got tangled between 50 & 21 EMA. The momentum oscillator RSI (14) has been hovering below 50 levels for the past couple of weeks suggesting weak momentum on the cards.
Bank Nifty’s next major demand zone is situated at 44,100. The index can also find support at 44,000 for next trading session. Immediate resistance for Bank Nifty on the upside can be observed at the 44,900 level.
|
Indian markets:
- The domestic stock market experienced a surge on Friday, driven by positive global cues, especially due to the US PCE inflation meeting expectations.
- Positive domestic economic data played a pivotal role in boosting market sentiment, with higher-than-expected manufacturing PMI and favorable GDP growth figures contributing to the optimism.
- Commencing the day at 19,258.15, the Nifty 50 index displayed consistent upward momentum throughout the trading session, ultimately closing above the 19,400 mark.
- Nifty Metal, Nifty Auto, and Nifty PSU Bank outperforming the broader Nifty 50 index. Nifty Healthcare, Nifty Pharma, and Nifty Media lagging behind in performance.
|
Global Markets
- The global stock markets showed positive movement on Friday. Dow Jones futures rose by 118 points, indicating a positive opening in the U.S. stock market for the day.
- In Europe and Asia, markets edged higher as investors awaited the U.S. jobs report. This report is considered crucial in determining the future of Federal Reserve policy.
- Chinas official manufacturing purchasing managers index showed a slightly softer rate of contraction compared to the previous month. Additionally, Chinas central bank, the Peoples Bank of China, announced its first reserve ratio cut of 2023. The reserve requirement ratio for foreign exchange will be reduced by 200 basis points to 4% from 6%, starting on September 15.
- In the U.S., stocks had a mixed performance on Thursday following the release of inflation and weekly jobless data. Investors are eagerly awaiting the employment data due on Friday as it will provide insights into the Federal Reserves monetary policy outlook.
|
Stocks in Spotlight
- In August, Mahindra & Mahindra (M&M) reported robust auto sales of 70,350 vehicles, marking an impressive 19 percent growth compared to the same month last year when they sold 59,000 units. M&M also revealed that their domestic passenger vehicle sales for the month saw a substantial surge of 25 percent, reaching 37,270 units compared to 29,852 units in the previous year. Notably, the Utility Vehicles segment performed exceptionally well, with M&M achieving its highest-ever sales of SUVs, selling 37,270 vehicles in the domestic market and a total of 38,164 vehicles, including exports. This positive performance underscores M&M’s strength in the auto market.
- Maruti Suzuki experienced a significant surge in its stock price, climbing over 3 percent, following the company’s announcement of its highest-ever monthly wholesales in August, totaling 1,89,082 units. This marked a notable increase of 14 percent in dispatches to dealers compared to the previous August, when they delivered 1,65,173 units. Maruti Suzuki India (MSI) reported robust domestic passenger vehicle sales, with 1,56,114 units sold, reflecting a remarkable growth of 16 percent from the same period the previous year. This strong performance underscores Maruti Suzuki’s leading position in the country’s automobile industry.
- Eicher Motors saw a 2 percent increase in its shares as the company reported impressive auto sales for August. Eicher Motors recorded the sale of 6,476 vehicles in August, marking a remarkable year-on-year (YoY) growth of 29.4 percent. Specifically, their major business segment, ‘Eicher Trucks and Buses,’ reported a 27.5 percent YoY growth, with 6,239 vehicles sold. In terms of market segments, domestic sales surged by 30.4 percent YoY, totaling 5,907 vehicles, while exports showed a slight decline of 8.5 percent YoY, with 332 vehicles sold.
|
News from the IPO world🌐
- Rishabh Instruments IPO booked 31.65 times on final day
- Cryogenic tank maker Inox India files draft papers with Sebi for IPO
- Arkade Developers files IPO papers with SEBI
|
|
Day Leader Board
Nifty 50 Top Gainers | Stock | Change (%) | | NTPC | ▲ 5.00% | | JIOFIN | ▲ 5.00% | | ONGC | ▲ 4.10% | | JSWSTEEL | ▲ 3.50% | | TATASTEEL | ▲ 3.20% |
| Nifty 50 Top Losers | Stock | Change (%) | | CIPLA | ▼ -1.00% | | HDFCLIFE | ▼ -0.60% | | DRREDDY | ▼ -0.60% | | NESTLEIND | ▼ -0.40% | | ULTRACEMCO | ▼ -0.30% |
| |
Sectoral Performance | Top Sectors | Day change (%) | | NIFTY METAL | 2.88% | | NIFTY AUTO | 1.65% | | NIFTY PSU BANK | 1.60% | | NIFTY OIL & GAS | 1.56% | | NIFTY IT | 1.12% |
|
Advance Decline Ratio | Advance/Declines | Day change (%) | | Advances | 2124 | | Declines | 1554 | | Unchanged | 108 |
|
Numbers to track | Indices Name | Latest | % 1D | % YTD | | Dow Jones (US) | 34,722 | (0.5) % | 4.8 % | | 10 Year Gsec India | 7.2 | 0.00% | 4.70% | | WTI Crude (USD/bbl) | 84 | 2.5 % | 8.7 % | | Gold (INR/10g) | 59,113 | 0.00% | 7.80% | | USD/INR | 82.68 | 0.0 % | 0.0 % |
|
|
Please visit www.fisdom.com for a standard disclaimer.
|

