Daily Snippets
Date: 23rd October 2023 |
|
|
Technical Overview – Nifty 50 |
|
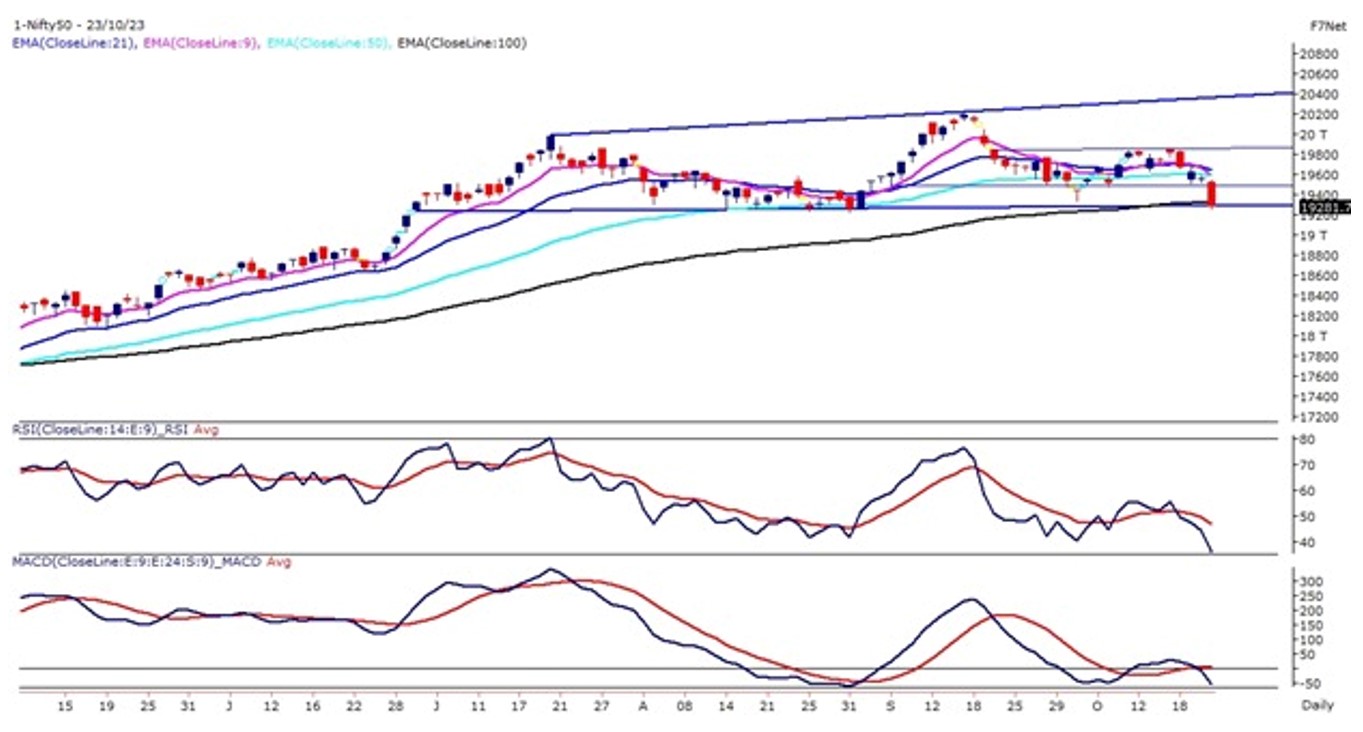
A deep sell-off in Nifty and Bank Nifty with small and mid-caps being monkey hammered. The Benchmark Index on its monthly expiry week started with a negative note mostly followed by its global peers. Initially, the index opened mildly lower but as the day progressed selling got intense and prices started to trade below 19,400 levels finally a sharp sell in the final hour dragged the Index below 19,300 levels.
The benchmark index on the daily chart has broken the rectangle pattern where the index traded within the range for more than three weeks. The prices on the daily chart are trading below their 9, 21, and 50 EMA and are acting as a strong resistance to the index.
The momentum oscillator RSI (14) has formed a rounding top formation near 55 levels and dip below 40 levels. The MACD indicator has entered below its polarity line with a bearish crossover. The index has broken its trend line support and selling on the rally will become the appropriate strategy for the index. The immediate hurdle for the index is placed at 19,500 and the downside levels are protected near 19,175 levels.
|
Technical Overview – Bank Nifty |
|
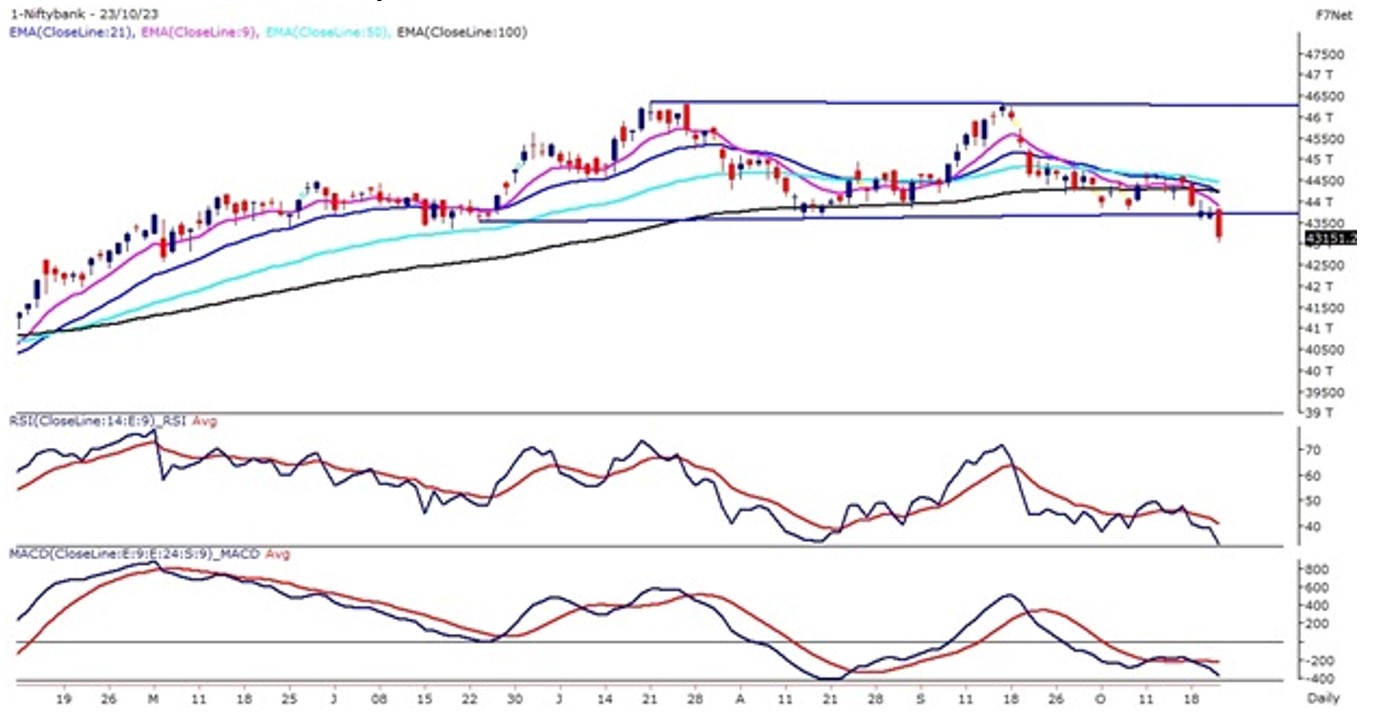
The Banking on its monthly expiry day started with a minor loss but as the day progressed the prices continued to trade lower and finally witnessed a rectangle pattern breakdown on the intraday time frame. The last hour of selling was too intense for the banking index where prices broke the rectangle pattern on the daily time frame.
The Banking index on the weekly chart too has witnessed an upward rising trend line breakdown and prices have found resistance near 21 EMA. The Banking index on the daily chart has drifted below its 9, 21 50 & 100 DEMA and the index closed below the same.
The momentum oscillator RSI (14) has formed a rounding top formation near 50 levels and dip below 35 levels. The MACD indicator has entered below its polarity line with a bearish crossover. The Banking index has broken its trend line support and selling on the rally will become the appropriate strategy for the index. The immediate hurdle for the banking index is placed at 43,800 and the downside levels are protected near 42,500 levels.
|
Indian markets:
- The domestic equity market faced a significant downturn on Monday, marking the fourth consecutive session of losses.
- Several factors contributed to the market decline, including negative trends in global markets, a rise in US bond yields, concerns about potential US interest rate hikes, and the ongoing Israel-Hamas conflict.
- These factors collectively heightened uncertainty among investors, leading to a dampened investor sentiment.
- The sell-off impacted sectors across the board, with mid- and small-cap stocks being hit the hardest.
- Sectors such as media, PSU (Public Sector Undertaking) banks, and metal shares experienced significant declines, reflecting the widespread nature of the market sell-off.
|
Global Markets
- The Dow Jones index futures were down 175 points, indicating a weak opening in the US stock market today.
- European stocks and Asian stocks both declined for the fourth consecutive day following the deepening selloff in US markets. Gold and crude oil prices also dropped, while the Japanese yen briefly weakened against the dollar, crossing the 150 mark. Traders attributed the decline in gold and crude oil prices to concerns over the geopolitical situation in the Middle East. Despite some positive developments, such as the release of two American hostages and aid being delivered to Gaza, there is still a risk of further conflict between Israel and Hamas, potentially involving other countries in the region.
- On Friday, US markets experienced significant declines, with the 10-year US treasury yield reaching its highest level since 2007. The S&P 500, Dow, and Nasdaq all recorded losses. Investors will closely monitor upcoming earnings reports and economic data releases as these factors are expected to significantly impact market movement in the future.
|
Stocks in Spotlight
- CreditAccess Grameen experienced a notable surge of 7.44 percent following impressive second-quarter earnings and a positive revision in the fiscal year 2024 guidance. The company’s net profit nearly doubled to Rs 347 crore in the September quarter, attributed to increased loan sales and resulting income. This substantial growth was reflected in a 53 percent surge in total income compared to the previous year, driven by a significant increase in net interest income (NII). Investors responded positively to these robust financial indicators, leading to a significant uptick in the company’s stock value.
- Ipca Laboratories witnessed a significant surge of approximately 6 percent following the favorable Voluntary Action Indicated (VAI) classification by the US Food and Drug Administration for its Ratlam unit, surprising the market positively. This development propelled the stock to reach its 52-week high on the stock exchanges, reflecting the strong investor confidence in the company’s prospects. The news of the VAI classification served as a catalyst, driving the stock’s impressive performance in the market
- Despite reporting a substantial net profit of Rs 1,323 crore, marking a significant 60 percent year-on-year increase for the second quarter ended September, IDBI Bank faced a decline of 5.88 percent in its stock value. This unexpected downturn occurred even as the bank showcased robust financial performance attributed to a decrease in bad loans
|
News from the IPO world🌐
- Blue Jet Healthcare sets IPO price band at Rs. 329-346, aims to raise Rs. 840 crore
- Mamaearth parent plans Rs. 1700 crore IPO on Oct 31st
- Motisons Jewellers completes pre IPO placement, raises Rs. 33 crore
|
|
Day Leader Board
Nifty 50 Top Gainers | Stock | Change (%) | | M&M | ▲ 0.2 | | BAJFINANCE | ▲ 0.1 |
| Nifty 50 Top Losers | Stock | Change (%) | | LTIM | ▼ -3.9 | | ADANIENT | ▼ -3.7 | | HINDALCO | ▼ -3.1 | | JSWSTEEL | ▼ -3 | | ADANIPORTS | ▼ -2.9 |
| |
Sectoral Performance | Top Sectors | Day change (%) | | NIFTY FMCG | 0.78 | | NIFTY FINANCIAL SERVICES | -1.03 | | NIFTY HEALTHCARE INDEX | -1.19 | | NIFTY PHARMA | -1.29 | | NIFTY BANK | -1.31 |
|
Advance Decline Ratio | Advance/Declines | Day change (%) | | Advances | 593 | | Declines | 3253 | | Unchanged | 144 |
|
Numbers to track | Indices Name | Latest | % 1D | % YTD | | Dow Jones (US) | 33,127 | (0.9) % | 0.0 % | | 10 Year Gsec India | 7.4 | 0.20% | 0.30% | | WTI Crude (USD/bbl) | 88 | (0.3) % | 14.5 % | | Gold (INR/10g) | 60,375 | 0.70% | 8.60% | | USD/INR | 83.19 | (0.1) % | 0.6 % |
|
|
Please visit www.fisdom.com for a standard disclaimer.
|

