Daily Snippets
Date: 30th October 2023 |
|
|
Technical Overview – Nifty 50 |
|
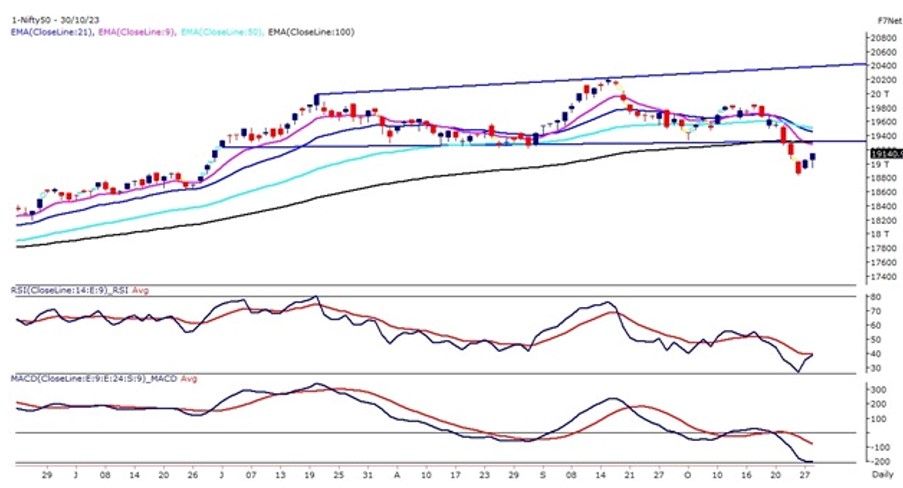
After a shaky start, the Nifty rebounded impressively, buoyed by positive sentiment from global markets. This resurgence can be attributed to short covering and bargain hunting, which rekindled optimism among bullish traders.
The Benchmark index on the intraday chart witnessed a downward-sloping channel pattern breakout and prices sustained above the upper band of the pattern throughout the day. The momentum oscillator RSI (14) has recorded a low near 25 levels which is an oversold level for the oscillator and post that moved higher.
Nifty50’s futures Contract expiring on 30th November, 2023 is trading at its 2nd lowest premium in about 6 months compared to the underlying Nifty price. Over the past 1 year, the future contracts of the index have been trading at a premium and the trend is being continued by the November expiry as well.
Now move above 19,150 to resume pullback to the 19,225 19,250 level, immediate support at 19,000 – 18950, as this is a corrective rise trade cautiously.
|
Technical Overview – Bank Nifty |
|
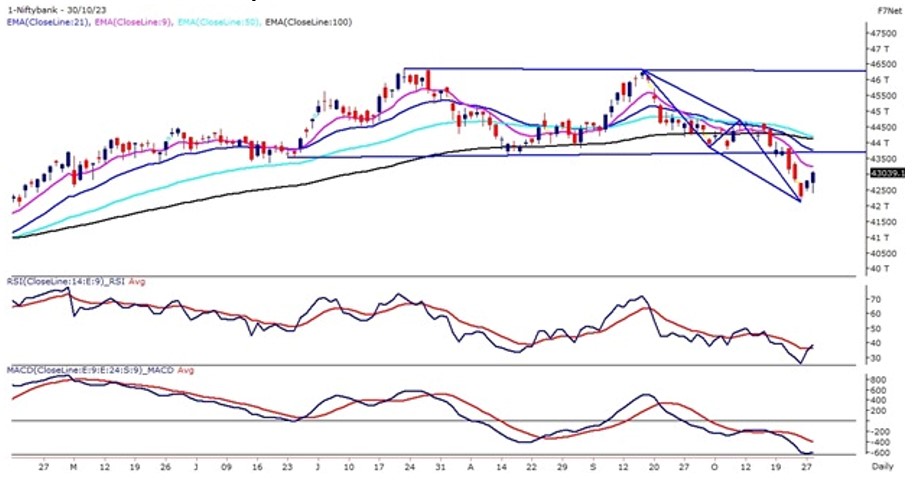
The Bank Nifty on the daily chart has formed a bullish ABCD Harmonic pattern and respected its potential reversal zone by witnessing a positive closing above 43,000 levels. The Banking index on the intraday chart has witnessed a triangle pattern breakout and prices sustained above the pattern for the majority of time.
On the weekly chart, the Banking Index is trading in a rising wedge pattern and prices are trading near the lower band of the pattern. The prices just closed above its 50 WEMA which is placed at 42,800 levels and is likely to act as an important pivot level.
Two back-to-back positive closings at the start of the November month expiry have gained some confidence among the trades. After a shaky start, on 30th October the Bank Nifty rebounded impressively, buoyed by positive sentiment in private sector banks. This resurgence can be attributed to short covering and bargain hunting, which rekindled optimism among bullish traders.
Now move above 43,200 to resume pullback to the 43,450 – 43,500 level, immediate support at 42,500 – 42,000, as this is a corrective rise trade cautiously.
|
Indian markets:
- The domestic stock market showed resilience with a second consecutive day of gains despite a negative start influenced by mixed global cues.
- Strong buying activity in major stocks from banking and oil & gas sectors led to a recovery, pushing indices to close near their peak.
- The Nifty index settled above the 19,100 mark, driven by buying in banking and oil & gas stocks.
- In the broader market, realty stocks were in demand while autos and consumer durables shares faced pressure.
- India’s foreign exchange reserves decreased by $2.36 billion to $583.53 billion in the week ended October 20, according to RBI data.
- Gold reserves increased by $1.85 billion to $45.42 billion during the same week.
- Special Drawing Rights (SDRs) were down by $70 million to $17.93 billion.
- India’s reserve position with the IMF rose by $6 million to $4.98 billion in the reporting week.
|
Global Markets
- The Dow Jones index futures were up 179 points, indicating a positive opening in the US stocks today.
- European shares advanced while most Asian stocks ended higher on Monday, ahead of a week of key economic data from around the region. Monetary policy decisions from Japan and Malaysia, inflation data from South Korea, and gross domestic growth figures from Taiwan and Hong Kong will be in focus this week.
- Risk appetite was dulled by Israels push to surround Gazas main city in a self-declared second phase of a three-week war against Iranian-backed Hamas militants.
- US stocks ended the day mixed on Friday as renewed selling occurred on Wall Street on fears of a recession. The Federal Reserve decision looms on Wednesday, where the central bank is widely expected to hold its benchmark interest rate at the same level. The Bank of England will announce its interest rate decision on Thursday.
|
Stocks in Spotlight
- Mahanagar Gas stock saw a significant rise of over 2 percent following the company’s strong financial performance. In Q2FY24, the gas distributor reported an impressive 106 percent year-on-year increase in net profits, reaching Rs 338.5 crore, as stated in the October 27 regulatory filing. Additionally, the company’s revenue experienced a growth of 0.5 percent, totaling Rs 1,570.9 crore. This positive financial report contributed to the stock’s gain, reflecting investor confidence in Mahanagar Gas’ robust performance.
- Macrotech Developers witnessed a notable surge of 2.78 percent following its return to profitability in the quarter ended September 2023. During Q2FY24, the real estate company reported a consolidated net profit of Rs 202.8 crore, marking a significant turnaround from the net loss of Rs 932.9 crore recorded in the same period last year. This positive financial performance led to the increase in Macrotech Developers’ stock value, indicating a strong recovery and investor confidence in the company’s operations.
- Indian Hotels Company (IHCL) witnessed a 2.04 percent increase in its stock value following its impressive sixth consecutive quarterly performance within the Tata group. Analysts are optimistic, foreseeing a continuation of this robust performance due to rising demand and increased occupancy levels. IHCL reported a 37 percent year-on-year rise in net profit, reaching Rs 167 crore in the July-September quarter of the current financial year. This positive financial report bolstered investor confidence, driving the uptick in IHCL’s stock price.
|
News from the IPO world🌐
- ESAF IPO to open on 3rd November
- IPO bound OYO’s loss declines 34% to Rs.1,287 crore in FY23
- Mamaearth IPO: Honasa Consumer sets price band at Rs. 308-324 a share
|
|
Day Leader Board
Nifty 50 Top Gainers | Stock | Change (%) | | BPCL | ▲ 3.5 | | ULTRACEMCO | ▲ 2.2 | | ONGC | ▲ 2.2 | | RELIANCE | ▲ 1.9 | | SBILIFE | ▲1.7 |
| Nifty 50 Top Losers | Stock | Change (%) | | UPL | ▼ -4.6 | | TATAMOTORS | ▼ -1.9 | | MARUTI | ▼ -1.5 | | EICHERMOT | ▼ -1.3 | | AXISBANK | ▼ -1.3 |
| |
Sectoral Performance | Top Sectors | Day change (%) | | NIFTY REALTY | 2.14 | | NIFTY OIL & GAS | 1.34 | | NIFTY BANK | 0.6 | | NIFTY FINANCIAL SERVICES | 0.59 | | NIFTY PRIVATE BANK | 0.55 |
|
Advance Decline Ratio | Advance/Declines | Day change (%) | | Advances | 2262 | | Declines | 1969 | | Unchanged | 132 |
|
Numbers to track | Indices Name | Latest | % 1D | % YTD | | Dow Jones (US) | 32,418 | (1.1) % | (2.2) % | | 10 Year Gsec India | 7.4 | 0.30% | 0.70% | | WTI Crude (USD/bbl) | 86 | 2.8 % | 11.2 % | | Gold (INR/10g) | 60,952 | 0.50% | 11.20% | | USD/INR | 83.24 | 0.1 % | 0.7 % |
|
|
Please visit www.fisdom.com for a standard disclaimer.
|


