Daily Snippets
Date: 28th July 2023 |
|
|
Technical Overview – Nifty 50 |
|
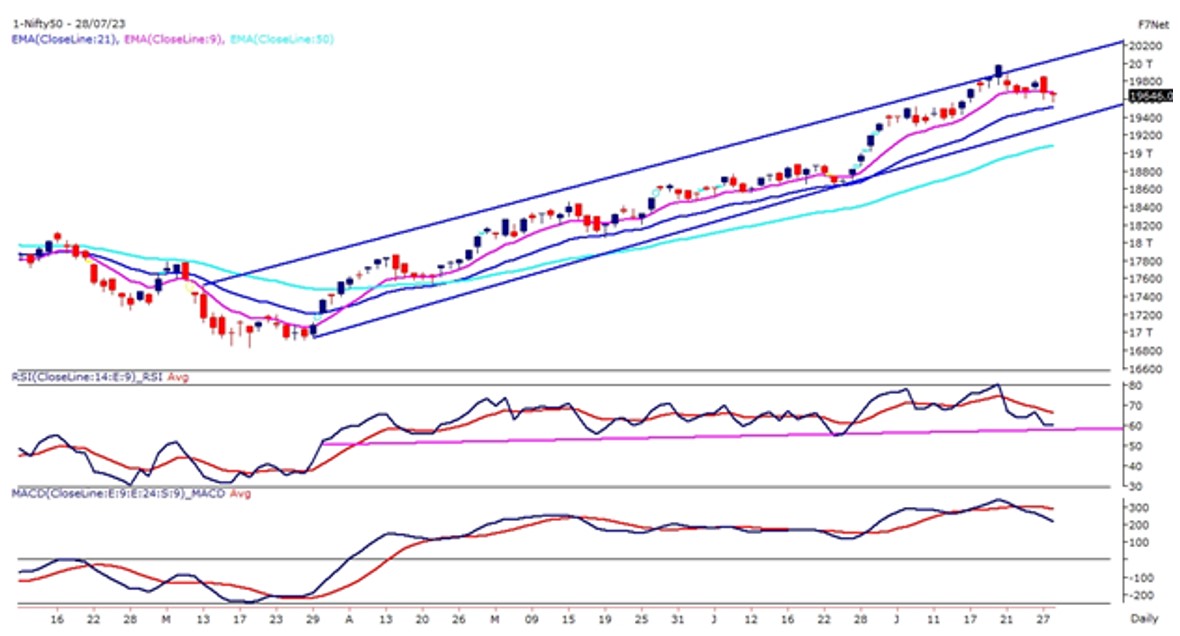
The Benchmark index has witnessed a negative closing after four weeks on the weekly time frame post the triangle pattern breakout suggesting the chances of a throwback towards the trend line support.
The Nifty50 on the daily time frame trades in a rising channel pattern and trades between 9 & 21-day exponential moving averages. After recording a high near the overbought zone, the momentum oscillator RSI (14) has drifted near to 60 levels with a bearish crossover.
Nifty has approached a significant support zone formed by multiple horizontal trend lines and the lower band of the Bollinger Band indicator. This zone ranges between 19,500 to 19,700 levels.
On the positive side, if Nifty manages to hold above 19,500, it could signal a potential bullish reversal in the short term. However, we must also remain cautious. The pattern’s bullish outlook negates if the Nifty breaks
below the crucial support level of 19,450. On the higher end, resistance is likely
to face near 19,850 levels.
|
Technical Overview – Bank Nifty |
|
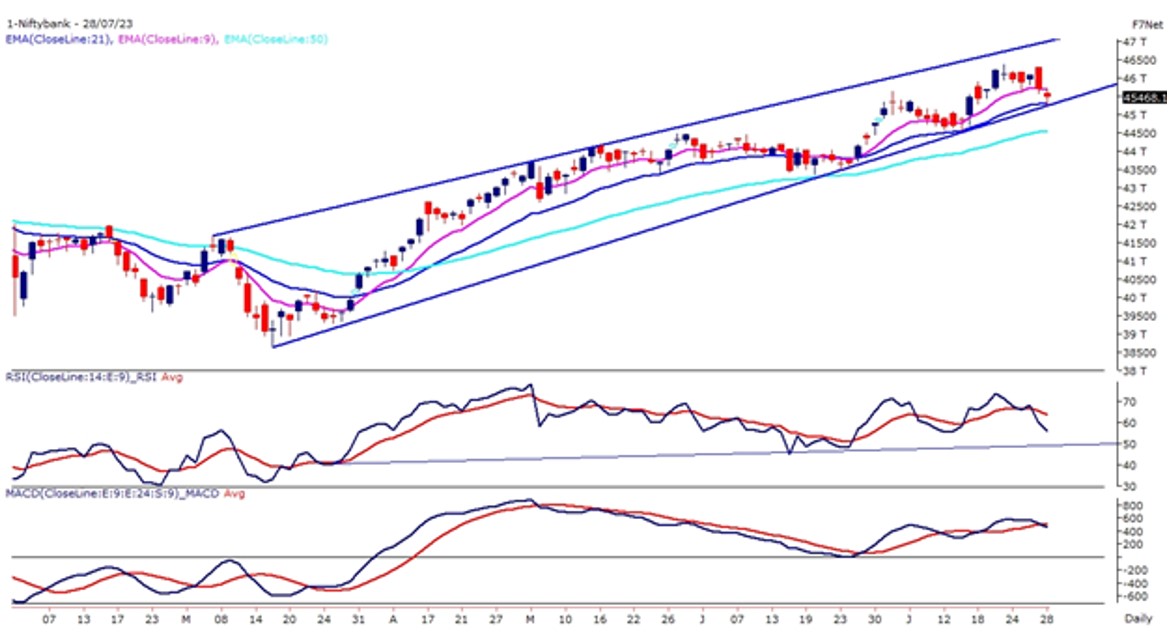
The Bank Nifty has formed an inside candle on the weekly chart and drifted lower by more than one percent suggesting a profit-booking scenario for the week. On the daily chart, the Banking index is trading in a rising wedge pattern and presently trading near the lower band of the pattern.
The Bank Nifty is trading between 9 & 21-day exponential moving averages on the daily chart and prices are trading in a higher high higher low formation. The momentum oscillator RSI (14) on the daily chart has faced resistance near 70 levels and drifted lower to 60 levels. Bank Nifty has approached a significant support zone formed by multiple horizontal trend lines and the lower band of the Bollinger Band indicator. This zone ranges between 45,200 to 45,800 levels.
On the positive side, if Bank Nifty manages to hold above 45,200, it could signal a potential bullish reversal in the short term. However, we must also remain cautious. The pattern’s bullish outlook negates if the Bank Nifty breaks below the crucial support level of 45,000. On the higher end, resistance is likely to face near 46,000 levels.
|
Indian markets:
- Major equity indices declined slightly on Friday, marking the second consecutive day of losses.
- The Nifty started strong, reaching a morning trading high of 19,695.90, but closed below the 19,650 level.
- Investor sentiment has been influenced by two key factors: a reduction in foreign portfolio investor (FPI) inflows and an upward movement of US bond yields.
- FMCG (Fast-Moving Consumer Goods) and realty shares experienced increased demand, showing positive trends in those sectors.
- In contrast, IT, banking, and financial sector shares witnessed a decline, signaling a bearish sentiment in these areas.
|
Global Markets
- Most European shares declined while Asian stocks ended mixed.
- The Bank of Japan kept interest rates at ultra-low levels on Friday and said that while it will continue with its yield curve control (YCC) operations, it will adopt a less strict approach to keeping yields within its target range.
- The European Central Bank (ECB) on Thursday increased the key interest rate in the eurozone by 0.25 percentage points to 4.25%. ECB President Christine Lagarde told a press conference that the bank will keep an open mind on future rate decisions.
- US stocks ended lower on Thursday after news that the Bank of Japan will allow long-term interest rates to rise sent US yields higher, snapping the longest winning streak for the Dow since 1987.
- Second-quarter US gross domestic product (GDP) rose at a 2.4% annual rate, according to the Commerce Department. That was up from a 2% growth rate in the first quarter.
|
Stocks in Spotlight
- India’s biggest engineering company, Larsen & Toubro (L&T), plans to give back extra money to its shareholders by repurchasing up to Rs 10,000 crore worth of shares through a buyback. The engineering conglomerate’s board has approved the proposal to buy back 3.33 crore shares, representing 2.4 percent of the total paid-up equity share capital, at a tentative price of Rs 3,000 per share, which is the maximum being considered by L&T at the moment. The offer represents an over-17 percent premium to the July 25 closing price of Rs 2,561.95.
- Indiabulls Housing Finance shares surged over 8 percent on July 28 after its board approved raising of funds up to Rs 35,000 crore. The company said that it will seek shareholders’ approval for the fundraise, which will happen through issue of NCDs and/or bonds. NCDs are non-convertible debentures. Along with the fundraise plan, the board also approved final dividend of Rs 1.25 per share for FY23. At 1 pm, the stock was quoting at Rs 137.85 on the National Stock Exchange, up over 8 percent from previous close. The stock is about 15 percent away from its 52-week high level of Rs 158.65. At the time, trading volumes at 31 million shares were about 3x the 20-day average volumes.
- Intellect Design Arena jumped over 20 percent on July 28 after reporting a strong set of numbers for the first quarter of FY24. Revenue grew 18 percent year-on-year to Rs 639 crore. The gross profit margins improved for another consecutive quarter to 56.8 percent. Net profit increased 36 percent YoY to Rs 93 crore in Q1FY24. The earnings before interest, tax, depreciation and amortisation (EBITDA) margin grew 23.1 percent from 21.6 percent in the same quarter of the previous year.
|
News from the IPO world🌐
- Fedbank Financial Services files IPO prospectus with Sebi
- Oriana Power is set to open its IPO on August 1,
- Yatharth Hospital IPO subscribed 5.63 times
|
|
Day Leader Board
Nifty 50 Top Gainers | Stock | Change (%) | | NTPC | ▲ 3.80% | | POWERGRID | ▲ 3.00% | | APOLLOHOSP | ▲ 2.50% | | ADANIPORTS | ▲ 1.60% | | M&M | ▲ 1.40% |
| Nifty 50 Top Losers | Stock | Change (%) | | BAJAJFINSV | ▼ -2.00% | | HDFCBANK | ▼ -1.80% | | BPCL | ▼ -1.50% | | TCS | ▼ -1.30% | | HCLTECH | ▼ -1.20% |
| |
Sectoral Performance | Top Sectors | Day change (%) | | NIFTY REALTY | 1.83% | | NIFTY MEDIA | 1.38% | | NIFTY METAL | 0.90% | | NIFTY FMCG | 0.88% | | NIFTY HEALTHCARE INDEX | 0.43% |
|
Advance Decline Ratio | Advance/Declines | Day change (%) | | Advances | 1755 | | Declines | 1788 | | Unchanged | 148 |
|
Numbers to track | Indices Name | Latest | % 1D | % YTD | | Dow Jones (US) | 35,283 | (0.7) % | 6.5 % | | 10 Year Gsec India | 7.2 | 0.60% | 3.90% | | WTI Crude (USD/bbl) | 80 | 1.7 % | 4.1 % | | Gold (INR/10g) | 59,096 | 0.30% | 7.80% | | USD/INR | 81.98 | 0.2 % | (0.8) % |
|
|
Please visit www.fisdom.com for a standard disclaimer.
|

