
Technical Overview – Nifty 50
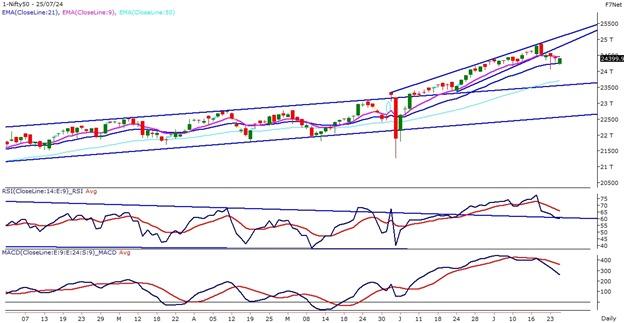
The index opened the day with a gap downward but rallied strongly from the 24,200 support level. On the 15-minute chart, the benchmark index formed a higher low and closed flat. The index experienced resistance at 10 DEMA even though it was able to close above 20 DEMA.
The fact that the RSI (14) momentum indicator is above 55 levels and has a hidden positive divergence suggests that the rising momentum is still present. On the weekly and daily charts, the index is still moving higher above the important moving average (EMA), suggesting that the upward momentum is still in place. The bearish crossover of the MACD indicates a lag in the rising trend.
Based on benchmark index OI data, a base formation may take place at the 24,300 level, where put writing is almost 25 lakhs. At 24,500, call writing is almost close to 30 lakhs, which might act as a resistance. The PCR value of the benchmark index is 0.96.
The view remains buy on dips. The support levels for the upcoming sessions are at 24,250 and 24,150 and resistance at 24,600 and 24,700, respectively.
Technical Overview – Bank Nifty
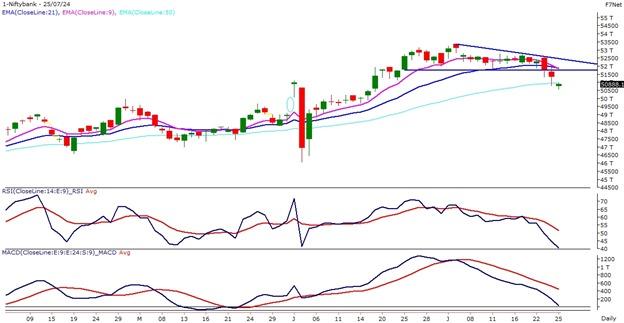
The banking index received a beating from the bears; it gapped down nearly by 1.5% but recovered from the 50,600 mark. The index encountered resistance at DEMAs 10 and 20, and it fell sharply from there. The index closed close to the 50,900 mark after forming a DOJI candlestick.
The RSI (14) momentum indicator dipped below the 45 mark and broke the daily chart’s rising trend line. The banking index appears to be under pressure, as evidenced by the closing below both the 10 and 20 DEMAs, which provided support for the index. Buying on dips is still advised even though the daily chart shows support for the index close to the 50 DEMA. A negative crossover of the MACD over the daily chart indicates a lagging upward trend.
Based on benchmark index OI data, a base formation may take place at the 50,500 level, where put writing is close to 14 lakhs. At 51,000, call writing is almost close to 21 lakhs, which might act as a resistance. The PCR value of the benchmark index is 0.77.
The resistance and support levels for the upcoming sessions are 51,150, 52,300 for resistance, and 50,600, 50,400 for support.
Indian markets:
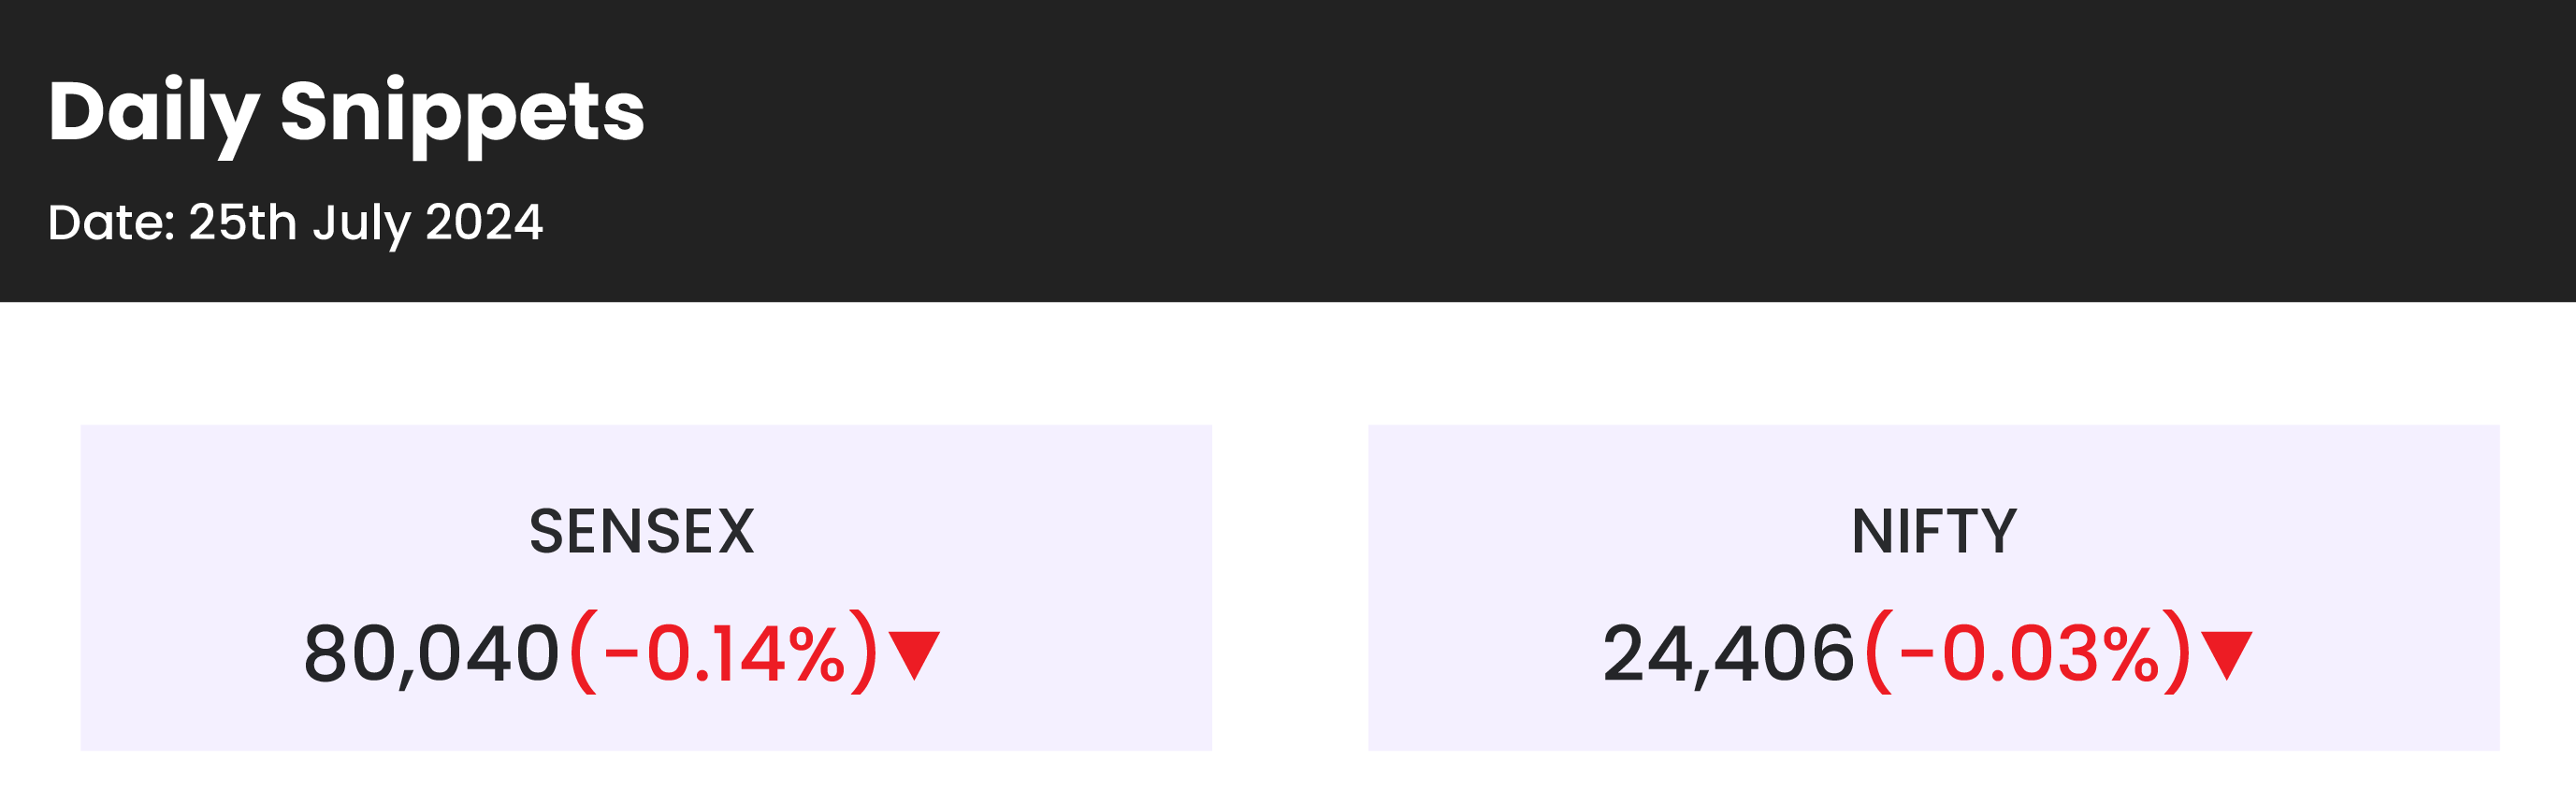
- Extending their losses into the fifth consecutive session, Indian stock market benchmarks, the Sensex and the Nifty 50, closed in the red on Thursday, July 25, influenced by weak global cues.
- The indices opened on a negative note and continued to decline throughout the day. However, buying at lower levels led to a partial recovery from the day’s lows, resulting in marginal losses.
- Sector-wise, the auto, capital goods, power, oil & gas, healthcare, and media sectors saw gains of 0.5-3 percent. In contrast, the banking, IT, metal, realty, and telecom sectors experienced declines of 0.5-1 percent.
- The BSE midcap and smallcap indices also ended the day slightly lower.
Global Markets:
- Japan’s Nikkei 225 extended its losing streak to seven consecutive days, plunging 3.28% and leading declines among Asian indexes following Wall Street’s overnight tumble.
- The Nikkei closed at 37,869.51, its lowest level since April. The broader Topix fell 2.98% to 2,709.86, marking its largest one-day drop since February 2021. South Korea’s Kospi lost 1.74% to end at 2,710.65, while the Kosdaq fell 2.08% to 797.29, with SK Hynix, a major component, declining 8.87%.
- Hong Kong’s Hang Seng index was down 1.8% in its final hour of trading, and mainland China’s CSI 300 dropped 0.55%, its lowest since February.
- Australia’s S&P/ASX 200 fell 1.29% to 7,861.2.
Stocks in Spotlight
- KPIT Technologies: The stock fell 3.5 percent as brokerages remained divided after its quarterly earnings report. Some analysts are optimistic, suggesting the stock could reach Rs 2,100 due to a healthy order book. However, others believe the stock could drop by up to 40 percent, citing rich valuations.
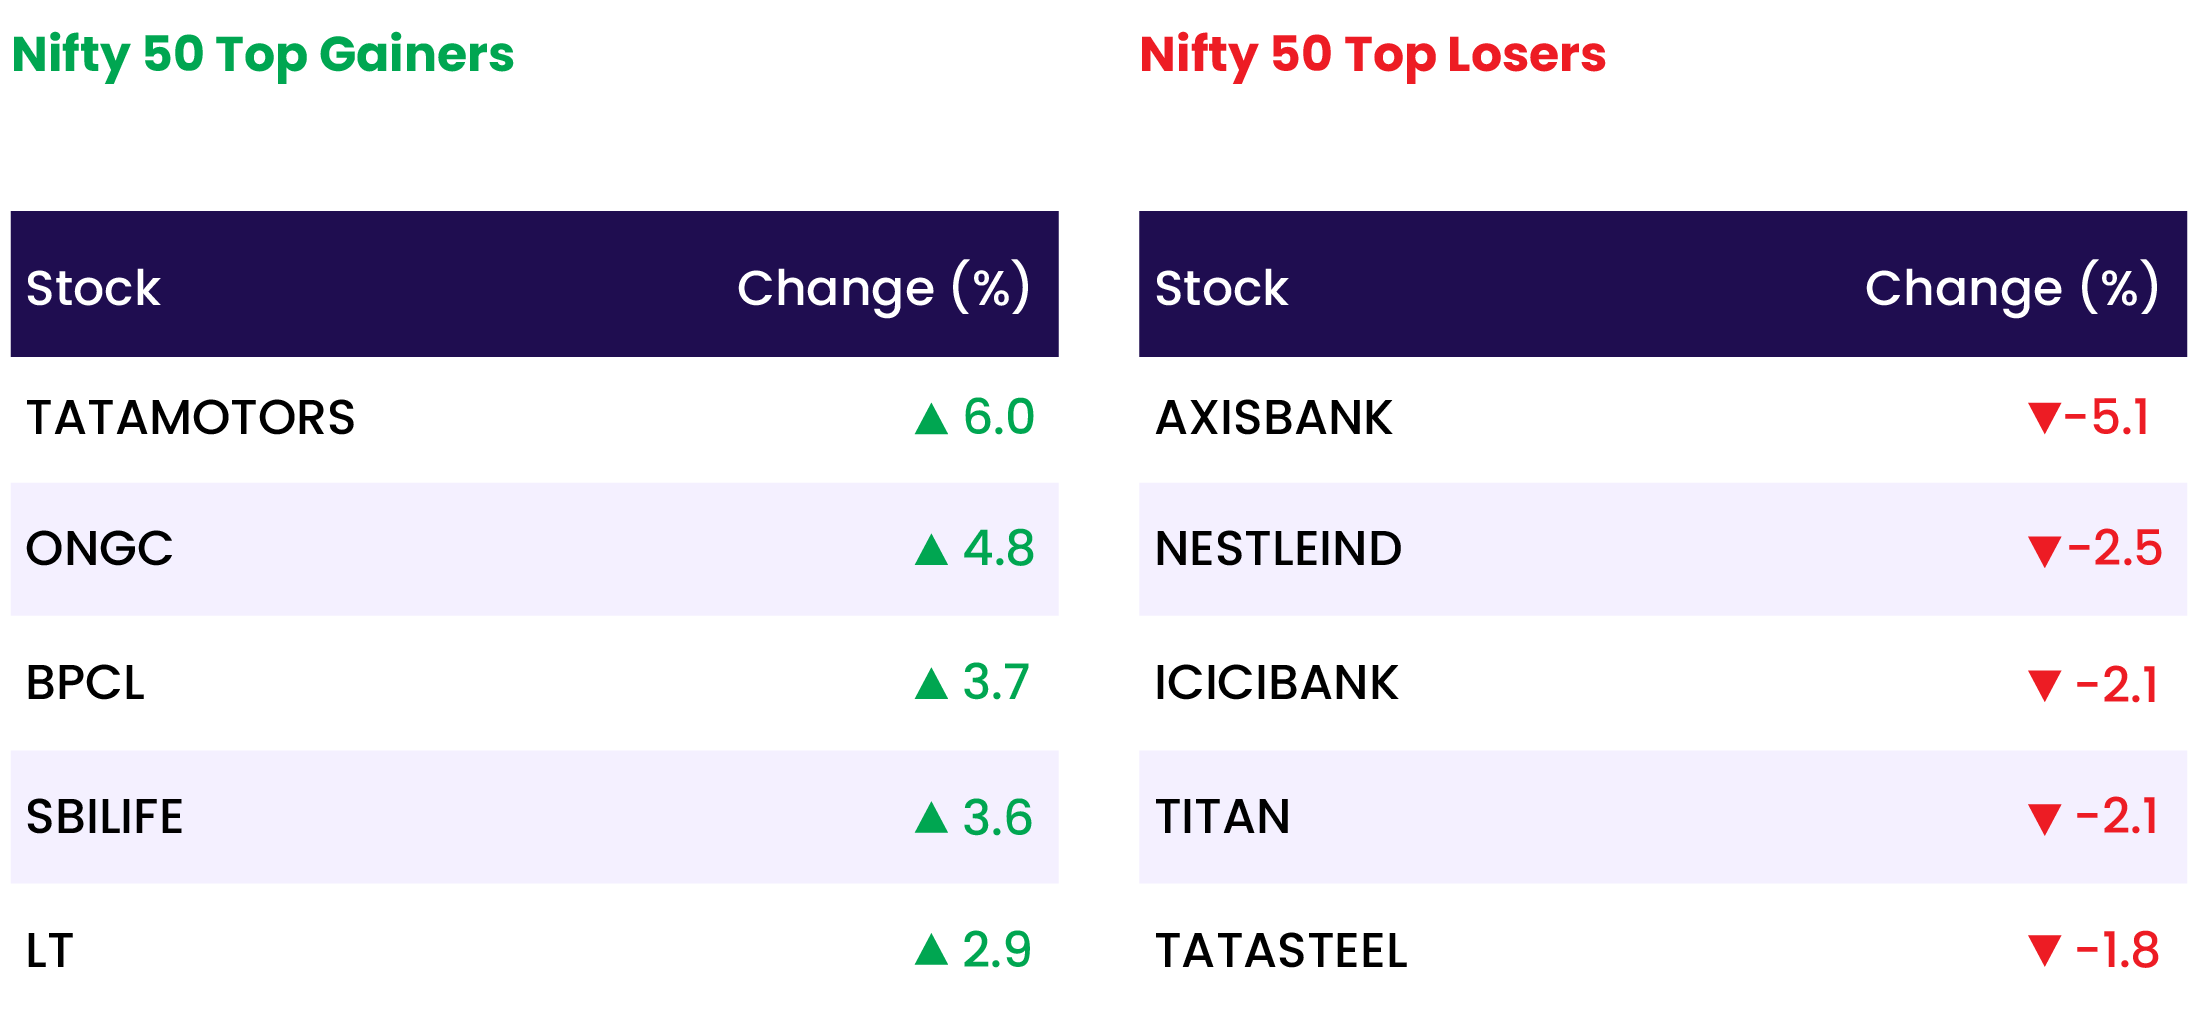
- Axis Bank: Shares took a 5 percent dive after the lender reported its April-June earnings, highlighting worsening asset quality. The net profit for Q1 FY25 was Rs 6,035 crore, up from Rs 3,452 crore in the same period last year, surpassing the Street’s estimate of Rs 5,797 crore. Despite the strong net profit, investors were concerned about the rise in non-performing assets. The lender’s gross non-performing assets increased by 11 basis points to 1.54 percent, and net non-performing assets rose by 3 basis points to 0.34 percent.
- Tata Motors: Shares surged 6 percent after international brokerage Nomura upgraded the stock with a ‘buy’ recommendation, citing multiple growth levers. Analysts assigned a target price of Rs 1,294, implying an upside potential of 26 percent from current market levels. Over the past month, Tata Motors’ shares have rallied 13 percent. The potential significant upsides from Jaguar Land Rover’s (JLR) execution and the demerger of commercial vehicles (CVs) from passenger vehicles (PVs) are seen as value-unlocking catalysts.
- Larsen & Toubro: Shares rose 3 percent after brokerages either retained bullish calls or raised target prices on Larsen & Toubro (L&T) following its fiscal first-quarter earnings (Q1FY25), which marginally beat Street estimates. Analysts highlighted L&T’s dominant market position and flexibility in project selection, which enhances overall business profitability. L&T’s consolidated net profit for the quarter ended June 2024 increased by 12 percent year-on-year to Rs 2,786 crore, while revenue from operations rose 15 percent year-on-year to Rs 55,120 crore.
News from the IPO world🌐
- Stallion India Fluorochemicals gets Sebi’s approval to float IPO
- Sebi ready with speed gun on IPO Street
- Insurer Niva Bupa plans $360 million IPO.
Daily Leader board:
Sectoral Performance
| Top Sectors | Day change (%) |
| NIFTY OIL & GAS | 2.2 |
| NIFTY AUTO | 1.3 |
| NIFTY PHARMA | 0.9 |
| NIFTY MEDIA | 0.8 |
| NIFTY HEALTHCARE INDEX | 0.6 |
Advance Decline Ratio
| Advance/Declines | Day change (%) |
| Advances | 2096 |
| Decline | 1813 |
| Unchanged | 114 |
Numbers to track
| Indices Name | Latest | % 1D | % YTD |
| Dow Jones (US) | 39,854 | (1.3) % | 5.7 % |
| 10 Year Gsec India | 7.1 | 1.6 % | 4.1 % |
| WTI Crude (USD/bbl) | 78 | 0.8 % | 10.2 % |
| Gold (INR/10g) | 67,844 | (1.7) % | 1.5 % |
| USD/INR | 83.68 | 0.0 % | 0.8 % |
Please visit www.fisdom.com for a standard disclaimer