Daily Snippets
Date: 25th August 2023 |
|
|
Technical Overview – Nifty 50 |
|
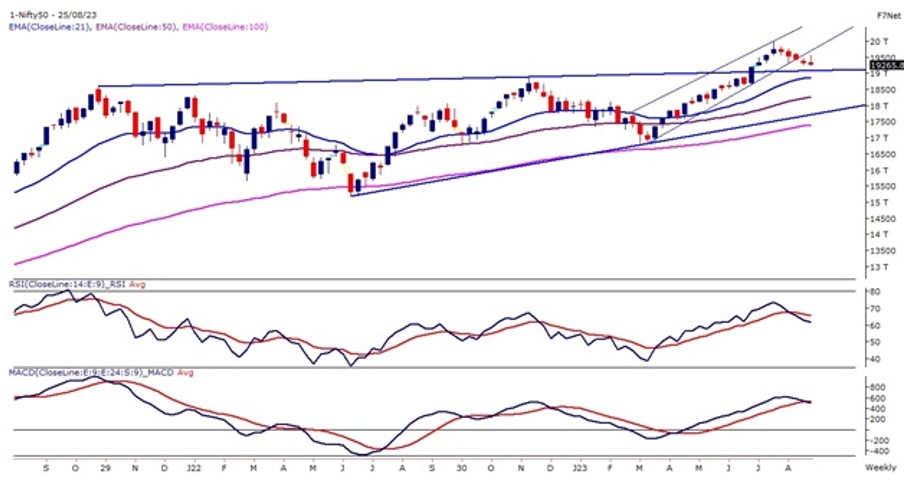
The Benchmark index maintained its consistency of closing in red for the fifth straight week and closed near 19,250 levels towards the close. The Nifty for this week has formed a tall wick on the higher end and a tiny little body on the lower which indicates prices could not sustain its highs and broke down.
Technically the Index has only fallen by 44 points for the week but the impact of volatility was too high for traders. The index from the past 10 days in trading is within the narrow range of 300 points and has formed a smaller-degree rectangle pattern on the daily chart.
As per the weekly technical study prices are approaching near to its trend line support which is placed near 19,000 levels. Prices continue to trade above their 21 and 50-week exponential moving average on the weekly scale but the momentum oscillator RSI (14) deteriorated from the higher levels and drifted near 60 levels with a bearish crossover.
The major support for the index is placed at 19,000 levels and a break below the said levels will be a real sign of worry in the broader time frame. The immediate resistance for the index is placed near the high of the weekly candle which is placed at 19,600 levels.
|
Technical Overview – Bank Nifty |
|
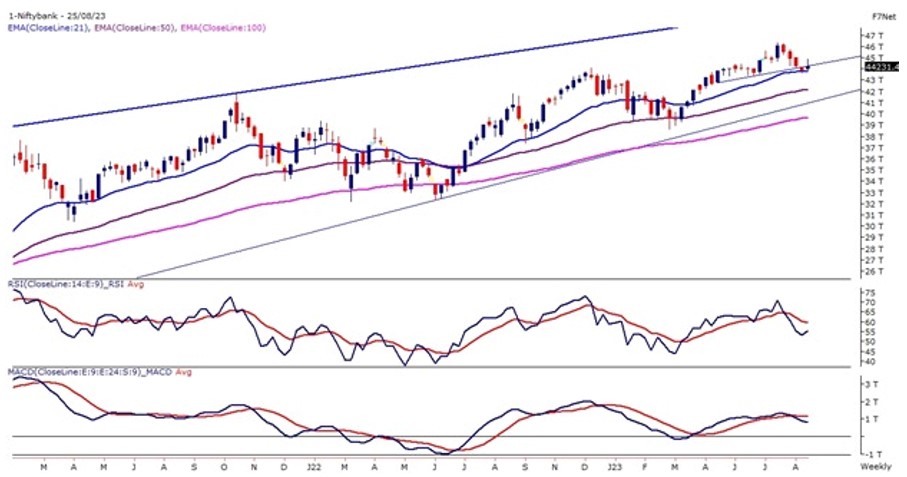
The Benchmark index maintained its consistency of closing in red for the fifth straight week and closed near 19,250 levels towards the close. The Nifty for this week has formed a tall wick on the higher end and a tiny little body on the lower which indicates prices could not sustain its highs and broke down.
Technically the Index has only fallen by 44 points for the week but the impact of volatility was too high for traders. The index from the past 10 days in trading is within the narrow range of 300 points and has formed a smaller-degree rectangle pattern on the daily chart.
As per the weekly technical study prices are approaching near to its trend line support which is placed near 19,000 levels. Prices continue to trade above their 21 and 50-week exponential moving average on the weekly scale but the momentum oscillator RSI (14) deteriorated from the higher levels and drifted near 60 levels with a bearish crossover.
The major support for the index is placed at 19,000 levels and a break below the said levels will be a real sign of worry in the broader time frame. The immediate resistance for the index is placed near the high of the weekly candle which is placed at 19,600 levels.
|
Indian markets:
- Domestic equity indices declined on Friday, marking a second consecutive trading session of losses.
- The Nifty index concluded the day below the 19,300 mark.
- PSU banks, realty, and metal stocks all registered significant drops.
- Market participants were eagerly anticipating the speech by the US Federal Reserve chair at the annual Jackson Hole conference, expecting clues about forthcoming interest rate choices.
|
Global Markets
- The Dow Jones futures were trading 100 points higher, indicating a positive opening in the US markets today.
- Markets in Europe advanced while Asian stocks declined as investors prepared for signals on U.S. monetary policy from central bankers comments at the Jackson Hole meeting on Friday, including a speech by U.S. Federal Reserve chair Jerome Powell.
- In Asia, the core inflation rate for Japans capital Tokyo came in at 2.8% for August, slightly below the market expectation of 2.9%. This is the lowest growth rate seen in Tokyos core inflation since September 2022. Overall inflation for Tokyo came in at 2.9%, lower than the 3.2% seen in July.
- On Thursday in the U.S., all three major indexes fell as the tech fueled rally ended, with the Dow Jones Industrial Average seeing its worst day since March, while the S&P 500 and the Nasdaq Composite saw their biggest one-day loss since Aug. 2.
|
Stocks in Spotlight
- KFin Tech shares surged by 11 percent following Jefferies’ initiation of a ‘buy’ rating on the stock, accompanied by a target price of Rs 500. The foreign brokerage, recognizing KFin as a dominant force in mutual fund services and issuer solutions for listed companies, highlighted its market leadership and potential gains from the growing trend of financial savings. Jefferies’ report also noted KFin’s exploration of new growth opportunities in international markets and alternative avenues. The firm anticipates robust profits and cash flow growth for KFin Tech.
- The removal of Jio Financial Services from the Sensex and other BSE indices has been delayed by three days to September 1 due to the stock consistently triggering the lower circuit on August 24 and 25. Initially scheduled for removal on August 24, the action was first postponed to August 29. However, due to the stock’s consecutive lower circuit hits, the removal has been further pushed to September 1, as announced by the S&P Dow Jones Indices in a statement on August 25.
- Coforge Limited‘s shares concluded 2.5 percent lower following the acquisition of a 10.3 percent stake worth Rs 2,976 crore by several funds in the mid-sized IT firm. Notably, buyers included SBI Mutual Fund, Societe Generale – ODI, Smallcap World Fund Inc, Morgan Stanley Asia Singapore Pte, Kotak Funds – India Midcap Fund, ICICI Prudential Life Insurance Company, HDFC Mutual Fund, and Aditya Birla Sun Life Mutual Fund, as indicated by data.
|
News from the IPO world🌐
- Heating Equipment firm JNK India files draft IPO papers with SEBI
- TATA Group gets ready to launch TATA Tech IPO, plans to raise Rs. 5000 crore.
- Chennai based Basilic Fly Studio to launch IPO on September 1
|
|
Day Leader Board
Nifty 50 Top Gainers | Stock | Change (%) | | JIOFIN | ▲ 3.80% | | BAJAJFINSV | ▲ 2.40% | | ASIANPAINT | ▲ 0.90% | | BAJFINANCE | ▲ 0.70% | | ONGC | ▲ 0.70% |
| Nifty 50 Top Losers | Stock | Change (%) | | LT | ▼ -2.10% | | DRREDDY | ▼ -2.10% | | JSWSTEEL | ▼ -2.00% | | ADANIPORTS | ▼ -2.00% | | ADANIENT | ▼ -2.00% |
| |
Sectoral Performance | Top Sectors | Day change (%) | | NIFTY OIL & GAS | -0.29% | | NIFTY FINANCIAL SERVICES | -0.34% | | NIFTY PRIVATE BANK | -0.42% | | NIFTY MEDIA | -0.53% | | NIFTY BANK | -0.59% |
|
Advance Decline Ratio | Advance/Declines | Day change (%) | | Advances | 1444 | | Declines | 2200 | | Unchanged | 119 |
|
Numbers to track | Indices Name | Latest | % 1D | % YTD | | Dow Jones (US) | 34,099 | (1.1) % | 2.9 % | | 10 Year Gsec India | 7.2 | 0.20% | 4.90% | | WTI Crude (USD/bbl) | 79 | 0.2 % | 2.8 % | | Gold (INR/10g) | 58,436 | 0.00% | 6.60% | | USD/INR | 82.73 | (0.4) % | 0.1 % |
|
|
Please visit www.fisdom.com for a standard disclaimer.
|


