Daily Snippets
Date: 04th October 2023 |
|
|
Technical Overview – Nifty 50 |
|
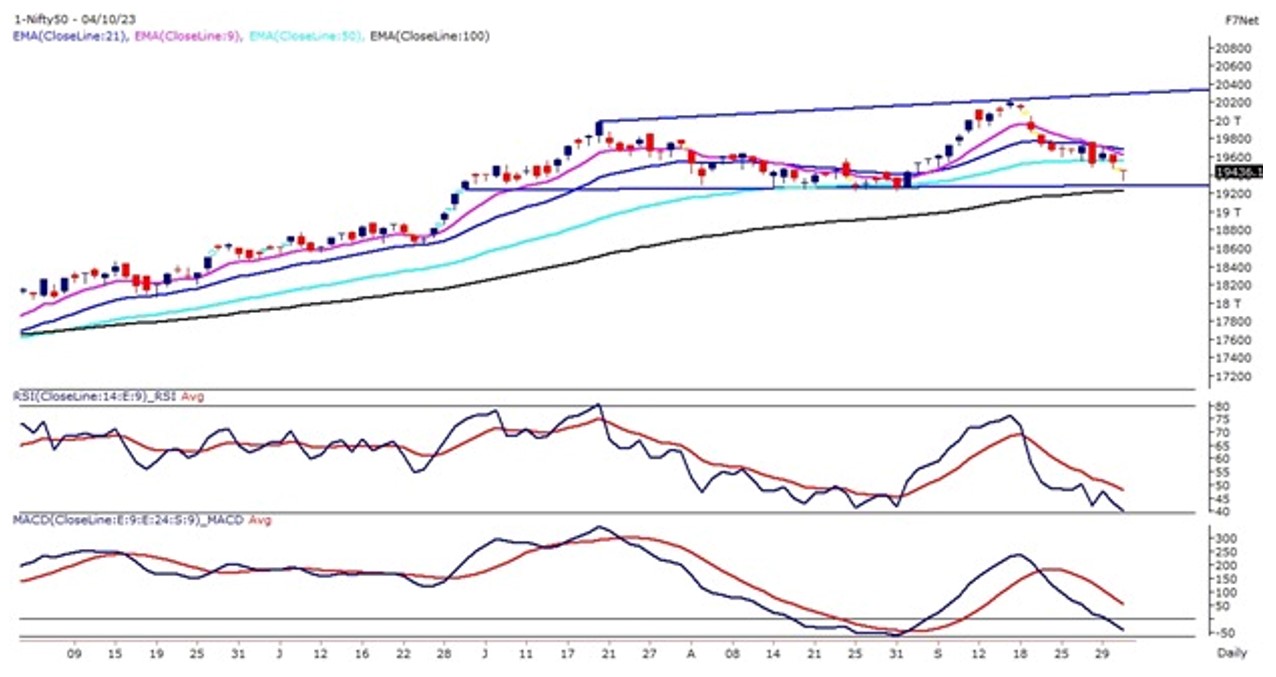
The Benchmark index on 04th Oct witnessed a sharp gap down opening following its global peers and traded in a negative terrain throughout the day. The index recorded a day low at 19,333 levels post-lunch session and witnessed a marginal recovery thereafter.
In terms of candle sticks the prices have formed a hammer pattern on the daily chart. The hammer pattern is considered as a bullish reversal pattern but one needs to wait for the confirmation of a positive closing above the high of the pattern.
The Nifty is presently trading within a broadening triangle pattern and has reached near the lower band of the pattern. The prices are trading below their short-term averages and the RSI (14) is hovering at 40 levels. The Advance Decline ratio was in favor of bears with a 1:2 ratio.
Immediate support for the index is placed at 19,300 – 19,200 levels and resistance is capped below 19,550 levels.
|
Technical Overview – Bank Nifty |
|
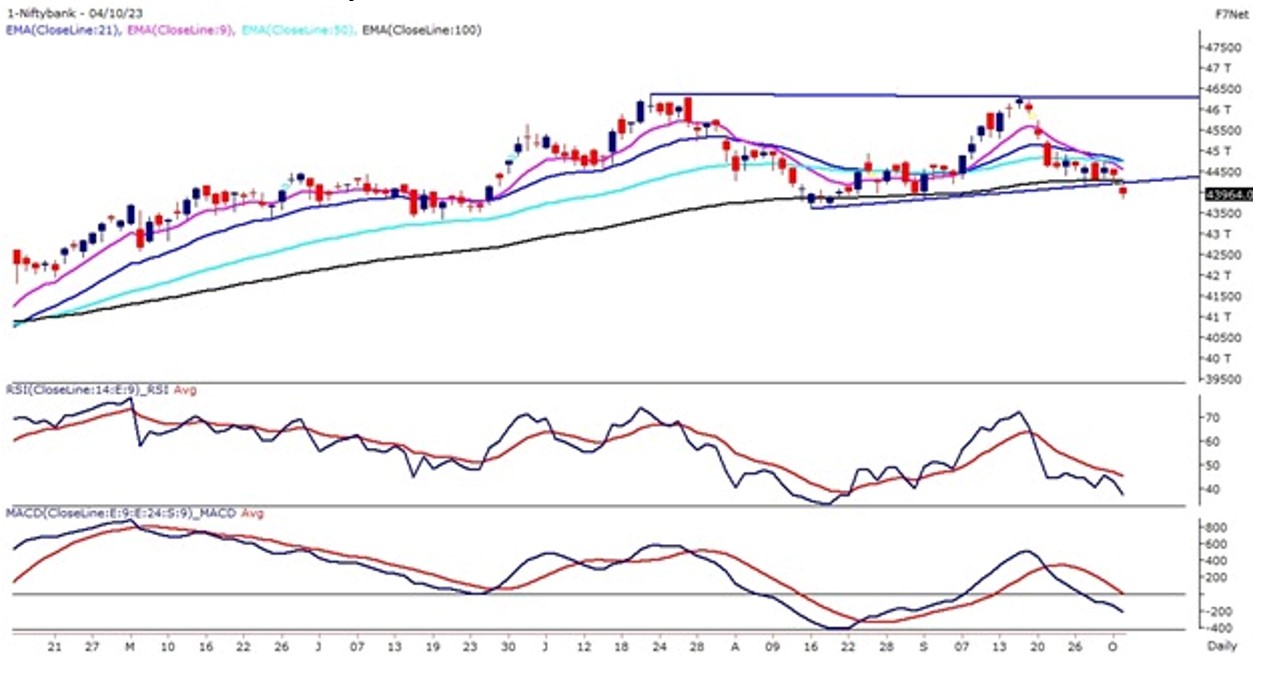
The Bank Nifty on 04th Oct witnessed a gap down opening and formed a continuation gap on the daily time frame. The Banking index has given a bearish breakdown of a rectangle pattern on the daily chart and prices sustained below the same for the entire day.
The prices on the daily chart are trading below their 21 & 50 & 100 day EMA and the momentum oscillator RSI (14) has moved below 40 levels with bearish crossover. The MACD indicator has crossed below its line of polarity with a bearish crossover.
As the index has witnessed a bearish breakdown the view remains sell on the rise for the banking index. The immediate support for the index is placed at 43,600 and the upside is capped at 44,300 levels.
|
Indian markets:
- Domestic equity indices experienced moderate losses for the second consecutive trading session.
- The decline was primarily driven by concerns over the unexpected increase in US job openings, raising worries about a potential Federal Reserve interest rate hike. This led to apprehension among investors.
- The yield on the 10-year US Treasury bond reached its highest level since August 2007, indicating increased volatility in the bond market.
- Market participants are eagerly awaiting the release of Q2FY24 earnings. Expectations are that these earnings reports will significantly influence market movements, with a focus on bottom-up investment strategies.
- Investors adopted a cautious approach, possibly due to the uncertainties in the market. This cautious stance was likely influenced by the impending Federal Reserve interest rate decision and other economic indicators.
- The monetary policy committee meeting scheduled for Friday, 6 October 2023, was a key focal point. Investors were eagerly awaiting the outcome of this meeting, which could potentially impact market sentiment and trading decisions.
- In terms of sectors, IT (Information Technology) and FMCG (Fast Moving Consumer Goods) shares were in demand, possibly indicating investor confidence in these sectors. Conversely, PSU (Public Sector Undertaking) banks and realty shares were under pressure, facing selling pressure from investors.
|
Global Markets
- European stocks traded higher while most Asian stocks declined on Wednesday after spike in the U.S. 10-year Treasury yield. Chinas markets remain closed for a weeklong holiday.
- The Reserve Bank of New Zealand left its key interest rate unchanged at 5.5%. The Central bank noted that the country’s growth outlook remains subdued even though GDP growth in the June quarter was stronger than forecast.
- US stocks tumbled on Tuesday as Treasury yields hit their highest levels since 2007, raising concern higher interest rates would freeze the housing market and tip the economy into a recession.
|
Stocks in Spotlight
- HDFC Bank’s September quarter shareholding pattern reveals that foreign institutional investor (FIIs) currently own 59 percent stake in the bank, leaving a headroom of approximately 20 percent. This indicates a rise from 18.3 percent in June 2023 when FIIs held 60.3 percent. The term ‘foreign room’ represents the available shares for foreign investors concerning the maximum limit, which currently stands at 74 percent for privately held banks. The higher the headroom or the lower the foreign holding, the higher the likelihood of increased weightage in the MSCI index.
- Tata Consultancy Services (TCS) has forged a multi-year partnership with UK retail powerhouse Asda to support its digital transformation and IT strategies after its split from Walmart. TCS’ shares were trading at Rs 3,489 apiece on the BSE, experiencing a 0.7 percent dip from the previous close at 12.52 pm. This collaboration aims to utilize TCS’ cloud, artificial intelligence, and security solutions to facilitate Asda’s secure separation, improve customer experience, foster innovation for market share expansion, and establish price leadership in the industry.
- L&T has revealed the acquisition of a substantial order for its power division, L&T Energy – Power, from West Bengal Power Development Corporation. This significant project falls within the range of Rs 1,000 crore to Rs 2,500 crore according to Larsen & Toubro’s classification.
|
News from the IPO world🌐
- Waaree Group aims to raise Rs. 2000 crore IPO
- JSW Infra IPO debuts in style lists at 20% premium
- Fincare Small Finance Bank IPO gets SEBI approval
|
|
Day Leader Board
Nifty 50 Top Gainers | Stock | Change (%) | | ADANIENT | ▲ 3.2 | | NESTLEIND | ▲ 3 | | EICHERMOT | ▲ 1.6 | | HINDUNILVR | ▲ 1.6 | | HDFCBANK | ▲ 1.6 |
| Nifty 50 Top Losers | Stock | Change (%) | | AXISBANK | ▼ -4.7 | | SBIN | ▼ -2.9 | | NTPC | ▼ -2.4 | | INDUSINDBK | ▼ -2.3 | | BAJAJ-AUTO | ▼ -2.2 |
| |
Sectoral Performance | Top Sectors | Day change (%) | | NIFTY IT | 0.3 | | NIFTY FMCG | 0.22 | | NIFTY CONSUMER DURABLES | -0.6 | | NIFTY OIL & GAS | -0.68 | | NIFTY FINANCIAL SERVICES | -0.79 |
|
Advance Decline Ratio | Advance/Declines | Day change (%) | | Advances | 1250 | | Declines | 2446 | | Unchanged | 99 |
|
Numbers to track | Indices Name | Latest | % 1D | % YTD | | Dow Jones (US) | 33,002 | (1.3) % | (0.4) % | | 10 Year Gsec India | 7.2 | 0.00% | -0.70% | | WTI Crude (USD/bbl) | 89 | 10.4 % | 16.0 % | | Gold (INR/10g) | 56,385 | -1.20% | 3.20% | | USD/INR | 83.2 | 0.1 % | 0.6 % |
|
|
Please visit www.fisdom.com for a standard disclaimer.
|

