
Valuable Insights From The History
Discipline investors emerged as the ultimate winner

- Consistent Market Performance: Regardless of election outcomes, the market has consistently delivered returns exceeding 12% over the subsequent three to five years, highlighting its resilience and growth potential. The highest returns were observed between 2004 and 2009 when neither the BJP nor Congress held a majority.
- Institutional Flows: Historical data shows that Foreign Portfolio Investment (FPI) inflows tend to exhibit a positive response in the period leading up to and following the general elections.
- MF Impact: Long-term SIP investors reaped the rewards due to their unwavering commitment. Even the underperforming funds yielded returns exceeding 9% in most cases. The leading performer within the core equities segment achieved returns surpassing 20%.

- Macro Indicators Prevail: Domestic and global macroeconomic indicators exert a more substantial and enduring influence on the markets than election results alone. Factors like economic fundamentals, corporate performance, global events, monetary policies, and geopolitics play pivotal roles.
- Balancing Short-Term Volatility: While elections can introduce short-term volatility and sentiment fluctuations, it’s essential to focus on the bigger picture, emphasizing a resilient, well-rounded investment approach.
Opinion Polls Suggests A Clear Victory For The BJP
The majority was only observed in the last two general elections starting from 1996
| Year | Constituencies Numbers | Winner at National Level | Seats contested (Numbers) | Seats won (Numbers | % share in valid votes (Per cent) |
| 1991 | 543 | INC | 500 | 244 | 36.4 |
| 1996 | 543 | BJP | 471 | 161 | 20.3 |
| 1998 | 543 | BJP | 388 | 182 | 25.6 |
| 1999 | 543 | BJP | 339 | 182 | 23.8 |
| 2004 | 543 | INC | 417 | 145 | 26.5 |
| 2009 | 543 | INC | 440 | 206 | 28.6 |
| 2014 | 543 | BJP | 428 | 282 | 31.3 |
| 2019 | 543 | BJP | 436 | 303 | 37.7 |

Source: India Today-CVOTER, India TV – CNX, Jefferies
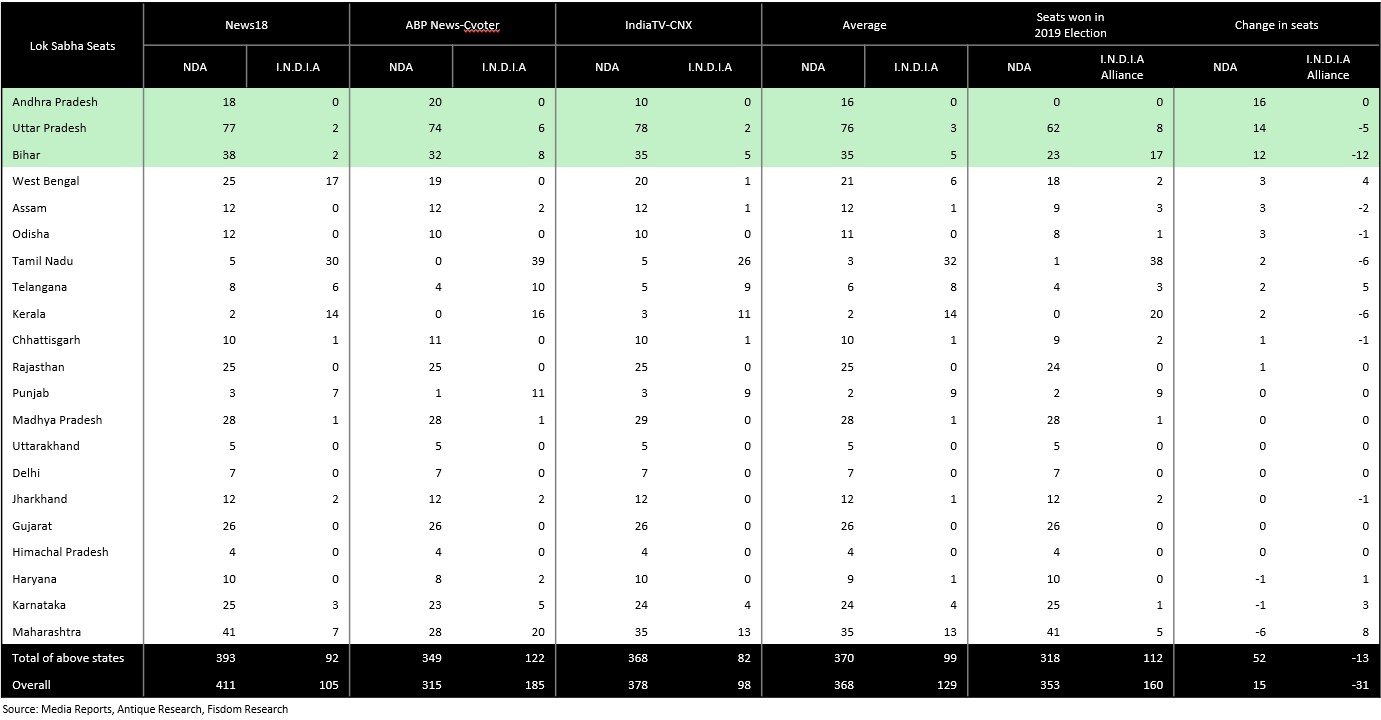
NDA’s Surge to 400 Seats Aided by AP, UP & Bihar: Polls
Election Years Often Witness Strong FPI Inflows
In some years, unexpected election results causing no party to secure a majority have led to short-term volatility in flows
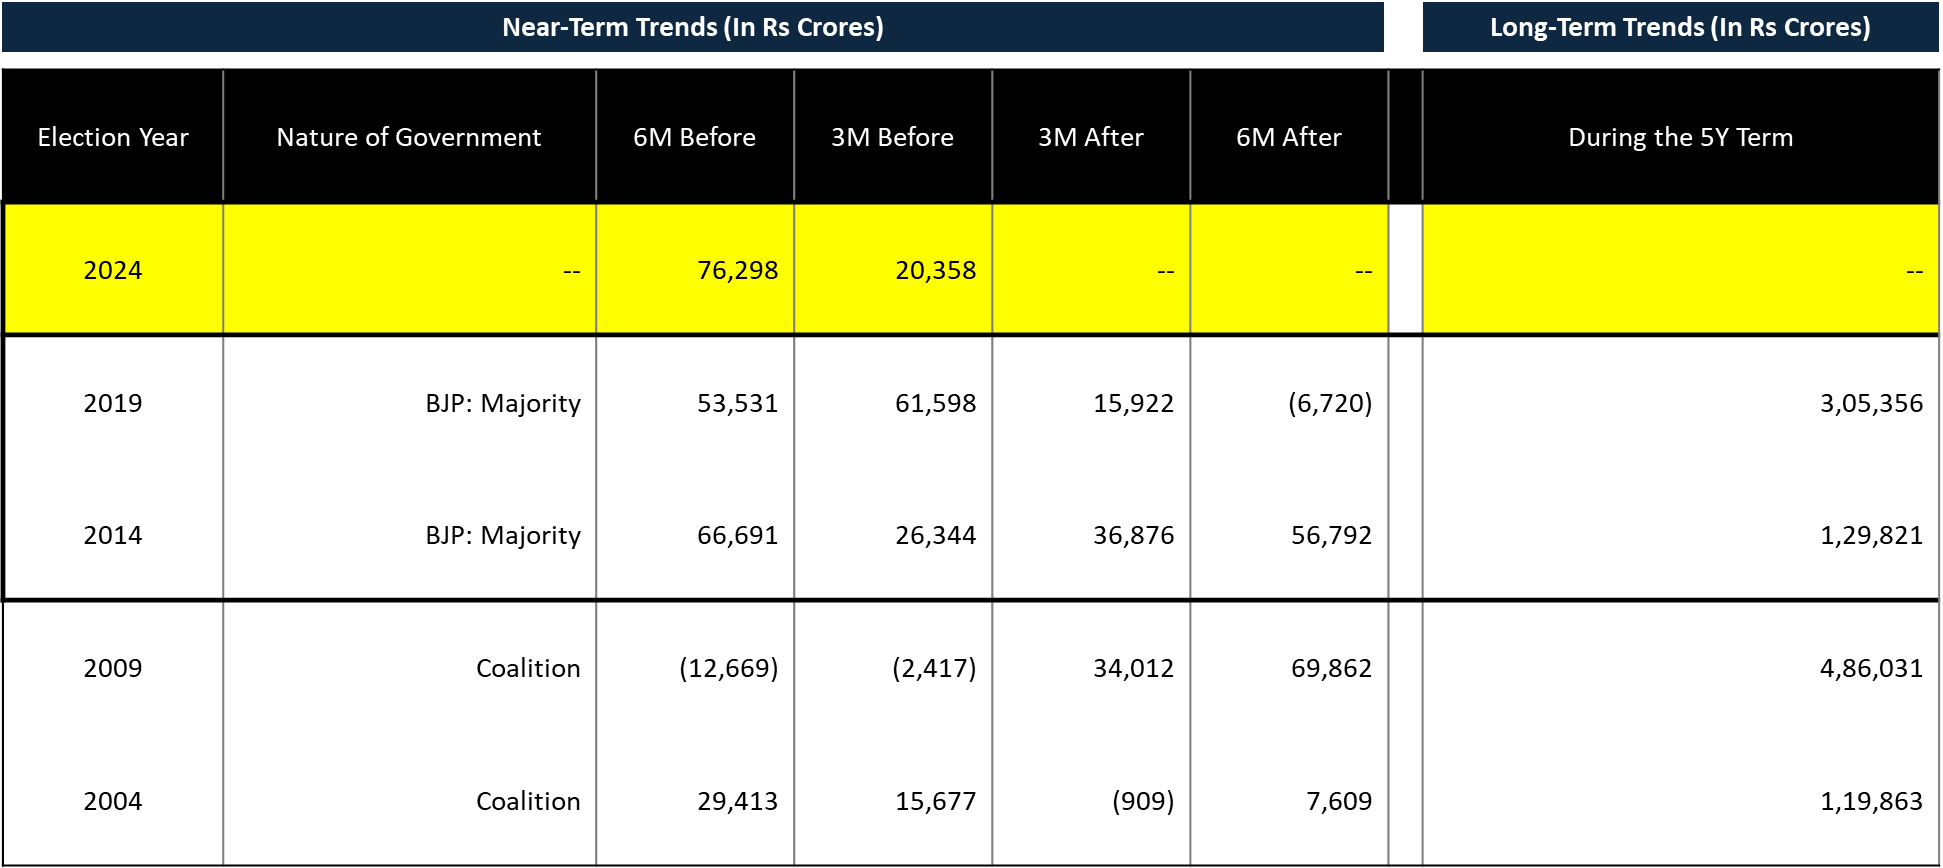
Source: Fisdom Research. We have considered Phase 1 of the election as the starting point of the election. *The latest data upto 15th March 2024 has been considered, Data Source: ACE MF