Daily Snippets
Date: 09th October 2023 |
|
|
Technical Overview – Nifty 50 |
|
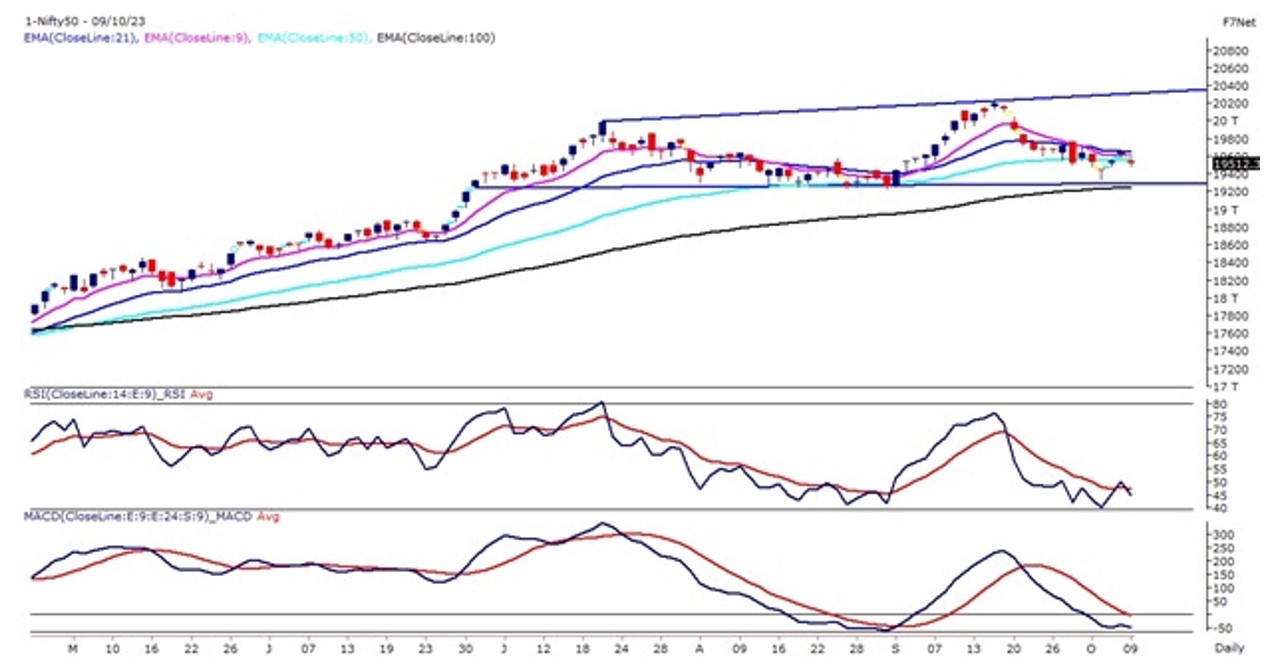
Nifty slipped into weakness on Monday after showing an upside bounce in the last two sessions. The Benchmark Index on 9th October witnessed a sharp gap down opening following its global; peers due to Israel Palestine War Impact on the Stock Market.
The Nifty on the daily chart has found a strong resistance below its 9 & 21 EMA which is placed at 19,600 & 19,650 levels. The momentum oscillator RSI (14) is hovering marginally below 50 levels and the MACD indicator has drifted below its polarity line with a bearish crossover.
The Index is trading within the broadening triangle pattern and presently approaching the lower band of the pattern. The short-term view remains bearish until clarity in the global markets. The immediate support for the index is placed at 19,400 – 19,300 levels and the upside is capped below the cluster of short-term EMA which is placed at 19,700 levels.
|
Technical Overview – Bank Nifty |
|
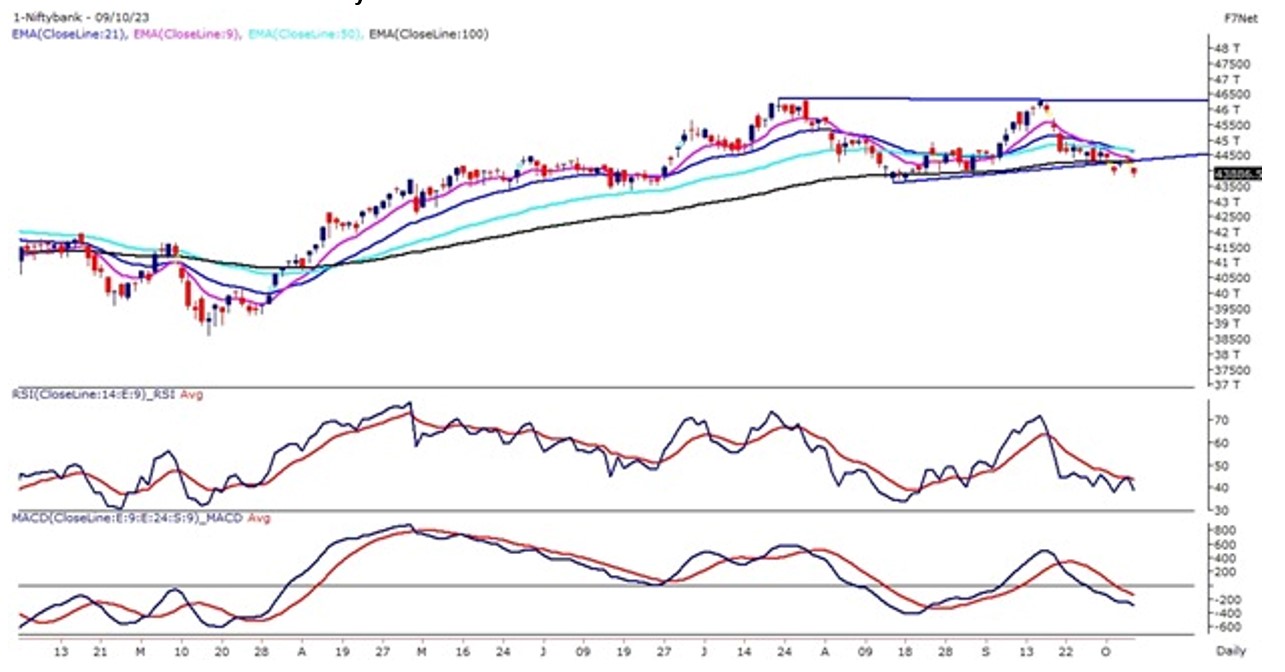
The Banking index retested its breakdown levels in the last two trading sessions and resumed its downtrend with a sharp gap down opening on 09th Oct. The Bank Nifty opened below the 44,200 level and sustained below the 44,000 level and closed with a loss of more a 1 percent.
In the last two trading sessions, the Banking index witnessed a pullback but was not able to close above its short-term EMA (9 & 21) on the daily time frame, which hinted at selling pressure on the higher end. The momentum oscillator RSI (14) is hovering below 45 levels and the MACD indicator has drifted below its polarity line with a bearish crossover.
On the broader time frame, the Bank Nifty has witnessed an upward rising trend line breakdown and prices are sustained below the same. The Sell On Rise should be the preferred strategy to trade Bank Nifty for the coming session. The immediate support for the Bank Nifty is placed at 43,500 levels and the resistance is placed at 44,400 levels.
|
Indian markets:
- Domestic stock market experienced a significant tumble today, primarily due to increased tensions in the Middle East, leading to a negative sentiment in global markets.
- Investor concerns heightened due to a sudden surge in oil prices, raising worries about rising inflation, a major contributor to the market downturn.
- The Nifty index settled below the 19,550 mark, indicating a notable decrease in market confidence.
- Investors engaged in portfolio reshuffling, particularly in mid- and small-cap stocks, reacting to high valuations in this sector, resulting in consolidation activities.
- Financials and consumer discretionary sectors were under pressure, with concerns arising about potential impacts on earnings if inflation continues to rise. In contrast, the IT sector demonstrated resilience during this period of market turbulence.
|
Global Markets
- The Dow Jones futures were down 150 points, indicating a negative opening in the US stock market today.
- Markets in Europe and Asia ended mixed on Monday, as investors assessed the implications of the military conflict in the Middle East and the associated surge in oil prices.
- The Israeli-Palestinian conflict intensified over the weekend, with the Islamist group Hamas carrying out attacks on Israeli towns. These attacks led to the loss of life and the abduction of Israelis, escalating the situation into a full-blown war. In response, Israel carried out airstrikes on various targets in Gaza, leading to numerous casualties. This new conflict, combined with the ongoing Ukrainian war, has caused oil prices to surge. The rise in oil prices is not only detrimental to most European and Asian stock markets but also carries the potential to contribute to inflationary pressures. This could prompt central banks to tighten monetary policies and additionally acts as a burden on consumers through increased expenses.
- US stocks rallied on Friday after the release of stronger-than-expected US jobs data and a pop in Treasury yields. Nonfarm payrolls increased by 336,000 jobs in September, the Department of Labor said, while data for August was revised higher to show 227,000 jobs were added instead of the previously reported 187,000. The unemployment rate was unchanged at an 18-month high of 3.8%.
|
Stocks in Spotlight
- Inox Green Energy Services witnessed a 1.86 percent drop in its stock value following the announcement of a strategic move. The company signed a term sheet for the complete divestment of its 100 percent stake in Nani Virani Wind Energy Private Limited SPV. This special purpose vehicle represents a 50 MW operational wind farm situated in Gujarat, commissioned in May 2023. The divestment aligns with the company’s strategic decision to achieve a net debt-free status.
- Metropolis Healthcare experienced a notable uptick in its stock price, closing 2.1 percent higher, following its robust performance in Q2FY24. The company reported early double-digit year-on-year growth for its core business and also marked an expansion in operating margins compared to the previous quarter. Metropolis Healthcare disclosed these impressive Q2FY24 results on October 6, showcasing its strong financial standing and operational efficiency.
- PB Fintech, the company behind Policybazaar, experienced a slight dip in its stock price, closing below 1 percent. This decline occurred as Softbank entities SVF Python II (Cayman) and SVF India Holdings (Cayman) sold off 11.4 million shares in the insurance player on October 6, Friday.
|
News from the IPO world🌐
- 28 IPOs worth Rs. 38,000 crore to hit the street in second half
- Manappuram Finance arm Asirvad Micro Finance files for Rs. 1500 crore IPO
- Fincare Small Finance Bank IPO gets SEBI approval
|
|
Day Leader Board
Nifty 50 Top Gainers | Stock | Change (%) | | DRREDDY | ▲ 1.1 | | HCLTECH | ▲ 0.9 | | TATACONSUM | ▲ 0.6 | | ONGC | ▲ 0.4 | | HINDUNILVR | ▲ 0.3 |
| Nifty 50 Top Losers | Stock | Change (%) | | ADANIPORTS | ▼ -5.1 | | HDFCLIFE | ▼ -2.7 | | HEROMOTOCO | ▼ -2.5 | | M&M | ▼ -2.2 | | TATASTEEL |
▼ -2.0 |
| |
Sectoral Performance | Top Sectors | Day change (%) | | NIFTY HEALTHCARE INDEX | 0.03 | | NIFTY IT | -0.1 | | NIFTY FMCG | -0.15 | | NIFTY PHARMA | -0.16 | | NIFTY REALTY | -0.79 |
|
Advance Decline Ratio | Advance/Declines | Day change (%) | | Advances | 977 | | Declines | 2830 | | Unchanged | 122 |
|
Numbers to track | Indices Name | Latest | % 1D | % YTD | | Dow Jones (US) | 33,408 | 0.9 % | 0.8 % | | 10 Year Gsec India | 7.4 | 0.60% | 0.80% | | WTI Crude (USD/bbl) | 83 | (1.7) % | 7.6 % | | Gold (INR/10g) | 56,582 | 0.40% | 3.50% | | USD/INR | 83.25 | (0.0) % | 0.7 % |
|
|
Please visit www.fisdom.com for a standard disclaimer.
|


