Daily Snippets
Date: 13th October 2023 |
|
|
Technical Overview – Nifty 50 |
|
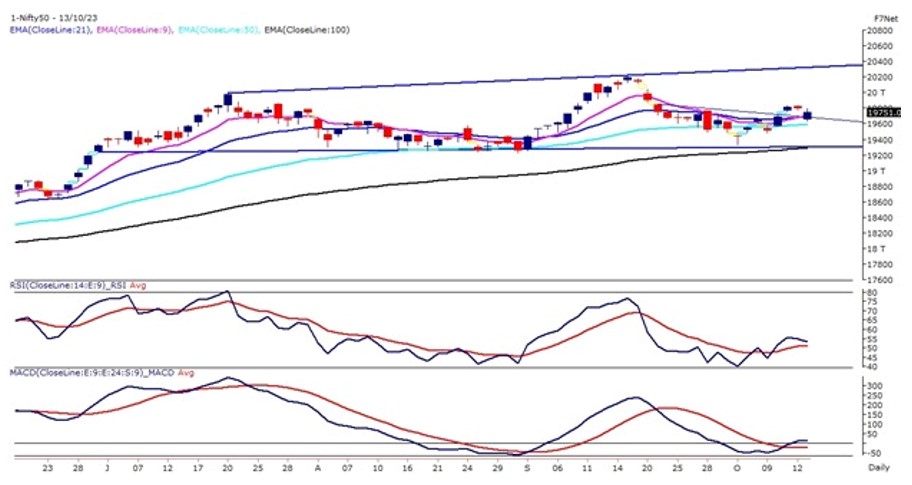
NIFTY50 on 13th October opened with a sharp cut following the global peers but was successful in recouping the opening losses towards the end of the day. On the weekly chart after forming a bullish dragonfly Doji candle stick pattern prices have closed above the previous week’s high indicating a follow-up buying in an index.
The Index seems to have completed its throwback on the bullish inverted head & shoulder pattern breakout which was given on 11th Oct. The prices have taken support near the neckline of the pattern which is also protected with a 9 & 21 EMA.
The near-term uptrend of Nifty remains intact and present weaknesses could be a buy-on-dips opportunity. Regarding options, the max OI for calls and puts was at 19,800 and 19,700, with the max pain point rising from 19,800 to 19,850. The immediate support at 19,650 – 19,700 levels. A sustained move above 19,850 levels will initiate a higher level of 20,000 levels.
|
Technical Overview – Bank Nifty |
|
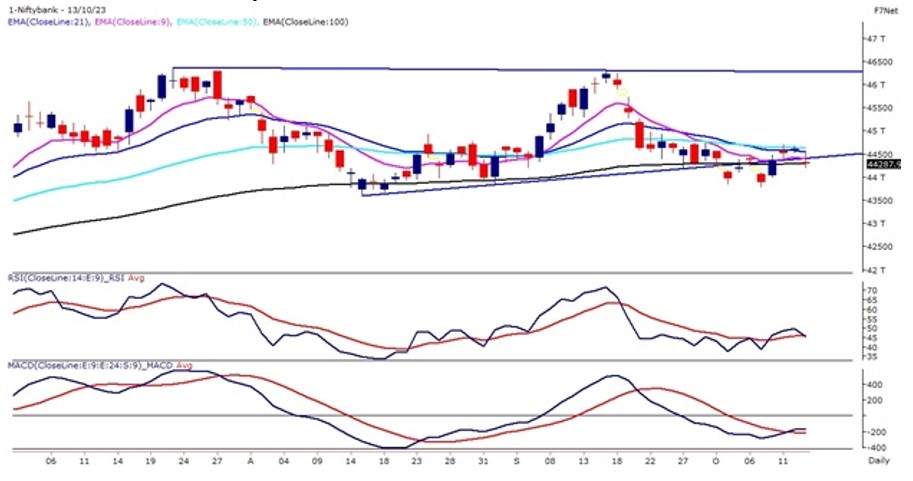
The Banking Index witnessed a gap-down opening with a massive cut and traded with super volatility throughout the day and closed below 44,400. BANKNIFTY on the daily chart has witnessed a consolidation breakdown and prices have completed the pullback of the pattern. The Banking Index faces a strong overhead resistance near its 21 & 50 EMA. Every time prices move near the said EMA selling pressure initiates.
On the weekly chart index has formed a spinning top candle stick pattern which certainly indicates volatility has an upper band at the present time. Regarding options, the max OI for calls and puts was at 44,500 and 44,000, with the max pain point rising from 44,300 – 44,500.
The momentum oscillator RSI (14) has again formed as a rounding top formation near 50 levels and shifted lower near the 45 mark. From the last few sessions, the Banking index has been facing strong and consistent resistance near its 50 EMA.
Keep an eye on the major hurdle at 44,600 according to my proprietary moving average theory. Additionally, the previous high of 44,800 could add a layer of resistance for the bulls. On the flip side, 43,800 is expected to act as a reliable support zone.
|
Indian markets:
- The market faced selling pressure on October 13, primarily due to the downward trajectory of IT heavyweights. Concerns regarding the demand outlook in the IT sector contributed to the negative sentiment.
- The market sentiment worsened as banking stocks experienced a slide, intensifying the selling pressure. Weakness in this sector further impacted market confidence.
- Domestic shares opened on a negative note influenced by weak global cues, setting a downtrend for the day’s trading.
- The market witnessed intraday volatility, reaching its lowest point at 19,635.30. However, there was a slight recovery, driven by some buying activity in the last hour, which helped mitigate losses to some extent.
- Market sentiment was dampened by a sudden spike in crude oil prices, adding to the overall negative outlook and investor concerns.
- Despite the prevailing weak market trend, auto and realty stocks defied the downturn, showing resilience amidst the overall negative market sentiment.
|
Global Markets
- Markets in Europe and Asia slipped across the board on Friday.
- In Europe, data revealed that the French Consumer Price Index (CPI) rose 4.9% annually in September, while the Spanish equivalent increased by 3.5% compared to the previous year. These figures align with expectations and suggest that the European Central Bank will maintain high interest rates due to consumer prices remaining significantly above their medium-term target.
- Additionally, economic data from China indicated a gradual stabilization in the countrys economy. Chinas exports and imports in September contracted at a slower pace compared to previous months. Exports fell by 6.2% in U.S. dollar terms, which was less than the expected 7.6% drop, while imports also declined by 6.2% on a year-on-year basis. Chinas Consumer Price Index (CPI) remained stagnant at 0% year-on-year in September, following a 0.1% increase in August. The Producer Price Index (PPI) in China dropped 2.5% year-on-year in September, compared to a 3% decline in the previous reporting period.
|
Stocks in Spotlight
- HDFC AMC stock experienced a significant surge of almost 4 percent following the release of robust September quarter results. Analysts raised their earnings growth estimates for the company, impressed by its strong performance. Brokerages expressed enthusiasm about HDFC AMC’s market share gains in the previous quarter, particularly in the active equity market where it increased to 12.4 percent
- Ircon International surged by over 10 percent after the Indian government bestowed ‘Navratna’ status upon the PSU, granting it greater operational autonomy. Ircon International Ltd., along with RITES Ltd., confirmed the elevation to “Navratna” status in exchanges. This recognition marks Ircon as the 15th Navratna company among the Central Public Sector Enterprises (CPSEs)
- In the September quarter of Financial Year 2023-24 (Q2 FY24), automobile manufacturers are expected to post robust results, driven by growth in various segments despite a slight dip in overall two-wheeler volumes. The rise in the average selling price (ASP) due to OEMs’ price hikes, coupled with an improved product mix, is set to bolster revenues and margins. Additionally, lower commodity prices compared to the previous year are enhancing margins in earnings before interest, taxes, depreciation, and amortization (EBITDA) for these manufacturers.
|
News from the IPO world🌐
- Arvind and Company Shipping Agencies IPO oversubscribed 15.37 times on day 1
- Manappuram Finance arm Asirvad Micro Finance files for Rs. 1500 crore IPO
- Paymate plans IPO in 6-9 months
|
|
Day Leader Board
Nifty 50 Top Gainers | Stock | Change (%) | | TATAMOTORS | ▲ 4.7 | | HCLTECH | ▲ 2.7 | | INDUSINDBK | ▲ 2.4 | | TATACONSUM | ▲ 2.2 | | NESTLEIND | ▲ 2.1 |
| Nifty 50 Top Losers | Stock | Change (%) | | AXISBANK | ▼ -2.4 | | ADANIENT | ▼ -2.3 | | INFY | ▼ -2.2 | | SBIN | ▼ -1.7 | | WIPRO | ▼ -1.5 |
| |
Sectoral Performance | Top Sectors | Day change (%) | | NIFTY AUTO | 0.88 | | NIFTY REALTY | 0.43 | | NIFTY HEALTHCARE INDEX | 0.34 | | NIFTY PHARMA | 0.32 | | NIFTY FMCG | 0.3 |
|
Advance Decline Ratio | Advance/Declines | Day change (%) | | Advances | 1761 | | Declines | 1911 | | Unchanged | 148 |
|
Numbers to track | Indices Name | Latest | % 1D | % YTD | | Dow Jones (US) | 33,631 | (0.5) % | 1.5 % | | 10 Year Gsec India | 7.3 | 0.20% | -0.20% | | WTI Crude (USD/bbl) | 83 | (0.7) % | 7.8 % | | Gold (INR/10g) | 57,613 | 0.00% | 5.20% | | USD/INR | 83.18 | (0.1) % | 0.6 % |
|
|
Please visit www.fisdom.com for a standard disclaimer.
|

