Daily Snippets
Date: 28th September 2023 |
|
|
Technical Overview – Nifty 50 |
|
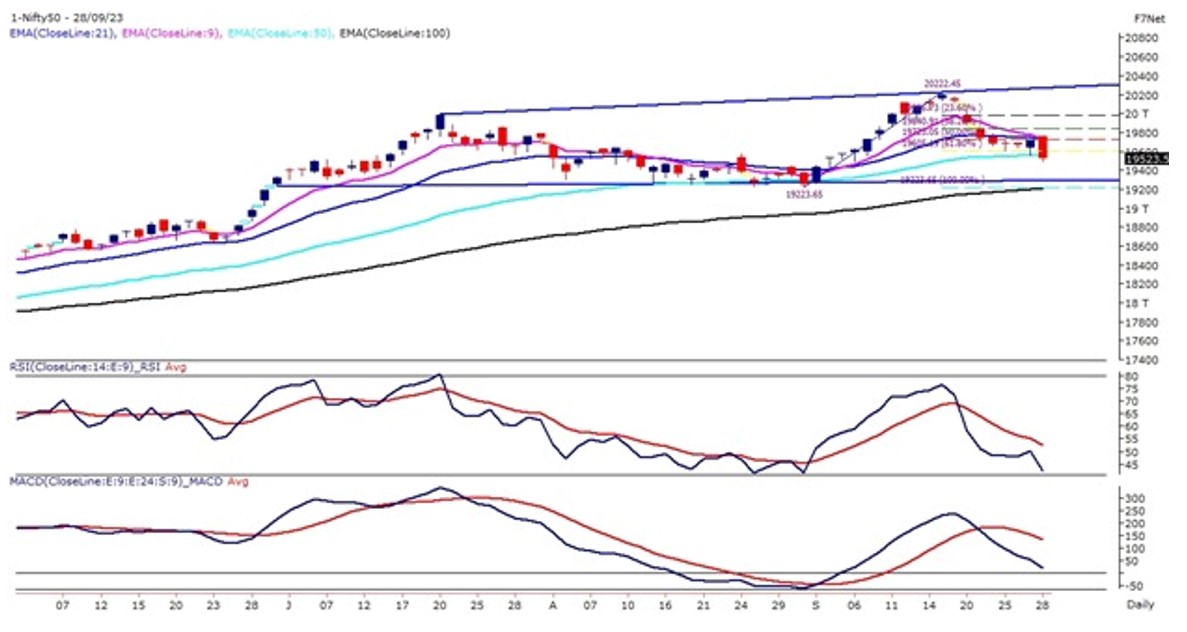
Nifty50 on its monthly expiry day witnessed a marginal gap up opening but couldn’t hold on to its gains and drifted lower in the early trades. The start was pretty volatile as the index gained some strength near 19,650 levels but as the day progressed prices drifted lower and continued to trade in a lower low formation.
The Benchmark index has failed its bullish hammer pattern which was formed in yesterday’s session and prices closed below the same. The prices on the daily were holding above the support of 61.80% Fibonacci retracement but the index eventually failed to sustain above the same and drift lower.
The Index has formed a bearish engulfing pattern on the daily chart indicating a bearishness in the prices. The prices have drifted below its 9 & 21 EMA and RSI has hooked lower below 50 levels. The immediate support for the Index is placed at 19,350 – 19,300 levels and resistance is placed at 19,750 levels as undertone remains bearish.
|
Technical Overview – Bank Nifty |
|
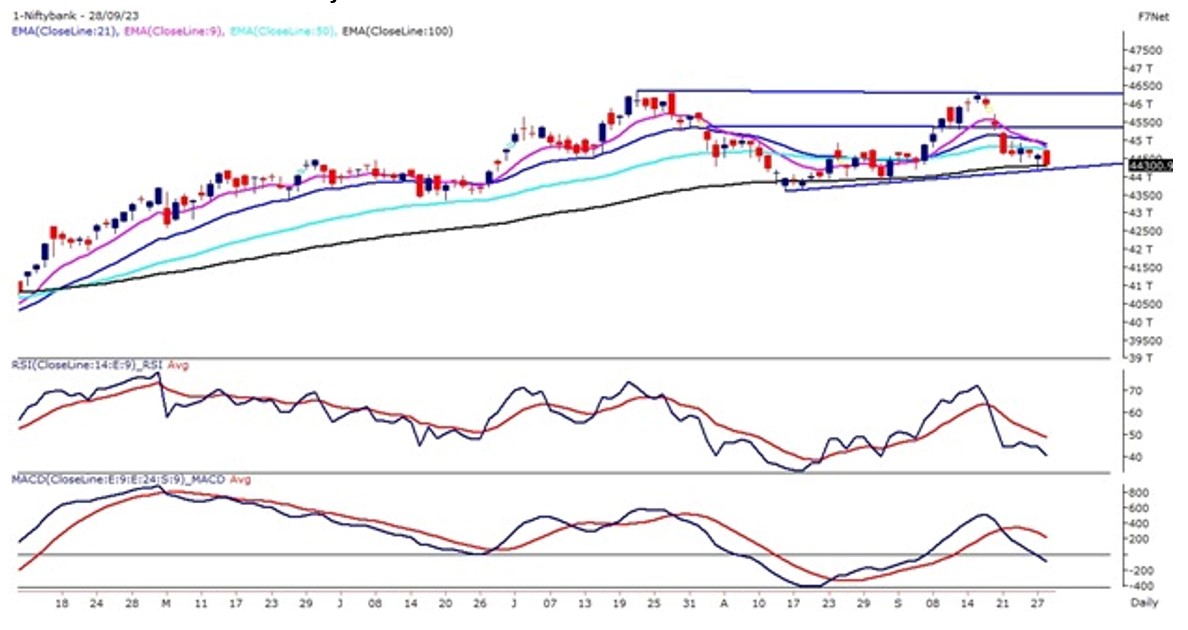
The Banking Index on its monthly expiry day witnessed a marginal gap up opening but couldn’t hold on to its gains and drifted lower in the early trades. The start was pretty volatile as the index gained some strength near 44,500 levels but as the day progressed prices drifted lower and continued to trade in a lower low formation.
The Benchmark index has failed its bullish hammer pattern which was formed in yesterday’s session and prices closed below the body of the pattern. The Bank Nifty is trading in a rectangle pattern and has taken support near the lower band of the pattern on the daily time frame.
A bearish dead cross has been witnessed in the banking index where 9 EMA has crossed below 21 EMA indicating a bearish sign for the index. The momentum oscillator RSI (14) has hooked lower below 45 levels with a bearish crossover.
The view remains bearish to sideways and the immediate support for the index is placed at 44,100 – 44,000 levels. A close below the said levels will be a bearish breakdown in the banking index. And an immediate resistance is placed at 44,800 levels.
|
Indian markets:
- Crude oil prices reached their highest levels in a year, putting upward pressure on the Indian equity market.
- The NSE (National Stock Exchange) indices underwent a reshuffling, coinciding with the expiry of Futures and Options (F&O) contracts, contributing to market volatility.
- Global economic conditions and cues were unfavorable, further impacting the Indian equity benchmark negatively.
- On September 28, the market experienced a sharp decline, resulting in the loss of Rs 2.40 lakh crore of investor wealth in a single day.
- Foreign institutional investors (FIIs) played a role in the downward trend by selling off their positions in the Indian market.
- India VIX, a measure of market volatility and fear, saw a significant increase, reflecting heightened market uncertainty.
- The decline was not limited to a few stocks; it was widespread across sectors. Notably, the Information Technology (IT) and Fast-Moving Consumer Goods (FMCG) sectors were among the top losers.
- The pressure extended to broader indices as well, with the midcap segment witnessing a decline of over 1%, and smallcap stocks closing marginally in the red
|
Global Markets
- European markets ticked lower Thursday, continuing the negative momentum seen for much of the week.
- The pan-European Stoxx 600 index was down by 0.1% around midday, with sectors mostly in negative territory. Travel and leisure stocks were down 1.1%, followed by tech, which was dragged lower by a 29% drop in the share price of Austrian chipmaker Ams-Osram.
- Oil and gas and mining stocks led minor gains, each with a 0.5% uptick
|
Stocks in Spotlight
- L&T surged, making them the top gainers on the Nifty 50 index. This increase in stock value preceded the anticipated settlement of the company’s share buyback bid, scheduled for the same day. The settlement process includes not only the resolution of bids but also the return of unaccepted equity shares and the distribution of consideration to eligible shareholders who participated in the buyback
- Bharti Airtel’s shares closed 1.17 percent higher at Rs 931 following the release of the Telecom Regulatory Authority of India’s (TRAI) monthly subscription data for July. The report revealed a notable net addition of 15.17 lakh subscribers to Bharti Airtel’s telecom services, building on the previous month’s increase of 14.1 lakh subscribers in June. As a result, the company’s market share in the wireless subscriber segment now stands at 32.74 percent.
- Power Grid saw positive trading activity as it anticipates receiving net passive inflows due to significant NSE index changes, encompassing Nifty Bank, Nifty 50, Nifty Next 50, and CPSE. According to Nuvama Institutional Equities, Power Grid stands to benefit from approximately $64 million in inflows.
|
News from the IPO world🌐
- Rockingdeals Circular Economy files IPO papers
- TATA gears up for India’s largest ever public offering with upcoming IPO
- Fincare Small Finance Bank IPO gets SEBI approval
|
|
Day Leader Board
Nifty 50 Top Gainers | Stock | Change (%) | | LT | ▲ 2.04 | | BHARTIARTL | ▲ 1.17 | | ONGC | ▲ 0.51 | | COALINDIA | ▲ 0.46 | | POWERGRID | ▲ 0.43 |
| Nifty 50 Top Losers | Stock | Change (%) | | TECHM | ▼ -4.16 | | ASIANPAINT | ▼ -3.69 | | LTIM | ▼ -3.02 | | M&M | ▼ -2.19 | | WIPRO | ▼ -2.08 |
| |
Sectoral Performance | Top Sectors | Day change (%) | | NIFTY FINANCIAL SERVICES | -0.49 | | NIFTY BANK | -0.64 | | NIFTY PRIVATE BANK | -0.86 | | NIFTY OIL & GAS | -0.86 | | NIFTY PHARMA | -0.9 |
|
Advance Decline Ratio | Advance/Declines | Day change (%) | | Advances | 1613 | | Declines | 2050 | | Unchanged | 127 |
|
Numbers to track | Indices Name | Latest | % 1D | % YTD | | Dow Jones (US) | 33,619 | (1.1) % | 1.5 % | | 10 Year Gsec India | 7.2 | 0.00% | -1.70% | | WTI Crude (USD/bbl) | 90 | 0.4 % | 17.5 % | | Gold (INR/10g) | 58,478 | -0.40% | 6.90% | | USD/INR | 83.1 | 0.0 % | 0.5 % |
|
|
Please visit www.fisdom.com for a standard disclaimer.
|


