

Technical Overview – Nifty 50
Indian markets rose in the first part of the market, but the gains could not be sustained, and they went below the 24,000 level and finished near it. The index is trading toward the upper band of the rising band; nonetheless, the bias remains negative, with a rise in sell.
Momentum indicator RSI (14) has seen a rising trend line breakdown and closed below 55, indicating a loss of strength. The benchmark index price has closed below the 10 and 20 DEMA, which may act as resistance in the subsequent session.
On the weekly chart, the index is trading above the main EMA, has closed at the 10 EMA, and is consolidating between the 23,900 and 24,400 levels.
The short-term outlook is bearish to sideways. The support levels for the forthcoming sessions are 23,800 and 23,700, with resistance at 24,400 and 24,500, respectively.
Technical Overview – Bank Nifty
The banking index had a sell-on-rise; the index opened 0.70 percent higher, but the gap up could not be sustained, and it concluded below 50,000. The index is trading in a rising channel on the weekly chart and is currently approaching the lower band of the rising channel.
Momentum indicator RSI (14) on the weekly chart has broken a rising trend line and gone below 55, indicating a loss of bullish momentum. The banking index closed below 10, 20, and 50 DEMA, which may act as resistance in the following session.
The resistance and support levels for the next sessions are 50,200, 50,700 for resistance, and 49,500, 49,000 for support.
Indian markets:
- On August 6, the Indian markets couldn’t sustain their morning gains and closed lower for the third consecutive session, driven by volatility and mixed sectoral performance.
- The auto, banking, and oil & gas sectors declined by 0.5 percent each, while the IT, metal, and real estate sectors saw gains of 0.3 to 0.8 percent.
- The BSE midcap and smallcap indices both fell by 0.5 percent.
Global Markets:
- On Tuesday, Japanese stocks rebounded sharply after the Nikkei 225 and Topix had dropped over 12% in the previous session.
- The Nikkei 225, which had its largest decline since the 1987 Black Monday crash, surged 10.23% to close at 34,675.46, marking its biggest daily gain since October 2008 and the highest increase in index points ever.
- The Topix also climbed 9.3% to finish at 2,434.21.
- In South Korea, the Kospi rose 3.3% to 2,522.15, and the Kosdaq jumped 6.02% to 732.87, rebounding from an 8% drop that led to a temporary market halt on Monday.
- Mainland China’s CSI 300 ended almost unchanged at 3,342.98, while Hong Kong’s Hang Seng index remained flat near the end of its trading session.
- Australia’s S&P/ASX 200 gained 0.41%, closing at 7,680.6.
Stocks in Spotlight
- BEML’s shares fell over 7 percent despite its revenue increasing to Rs 634.6 crore from Rs 578 crore in the same period last year. The decline occurred because the revenue fell short of the company’s guidance.
- Hindustan Construction Company’s shares dropped over 6 percent following a report of a net loss of Rs 2.5 crore in Q1 FY25. Additionally, the company’s revenue fell by 6 percent year-on-year to Rs 1,816 crore.
- On August 6, Vedanta Ltd reported a 36.5 percent increase in consolidated net profit, reaching Rs 3,606 crore for the quarter ended June 30, 2024, up from Rs 2,640 crore in the same period last year. The company’s revenue from operations also rose by 5.6 percent to Rs 35,239 crore in Q1 FY25, compared to Rs 33,342 crore in Q1 FY24, according to an exchange filing.
News from the IPO world
- Ola Electric IPO subscribed 64% in 2 days.
- FirstCry IPO subscribed 5% on first day of bidding process
- Unicommerce eSolutions IPO fully subscribed, retail portion boo006Bed 5X
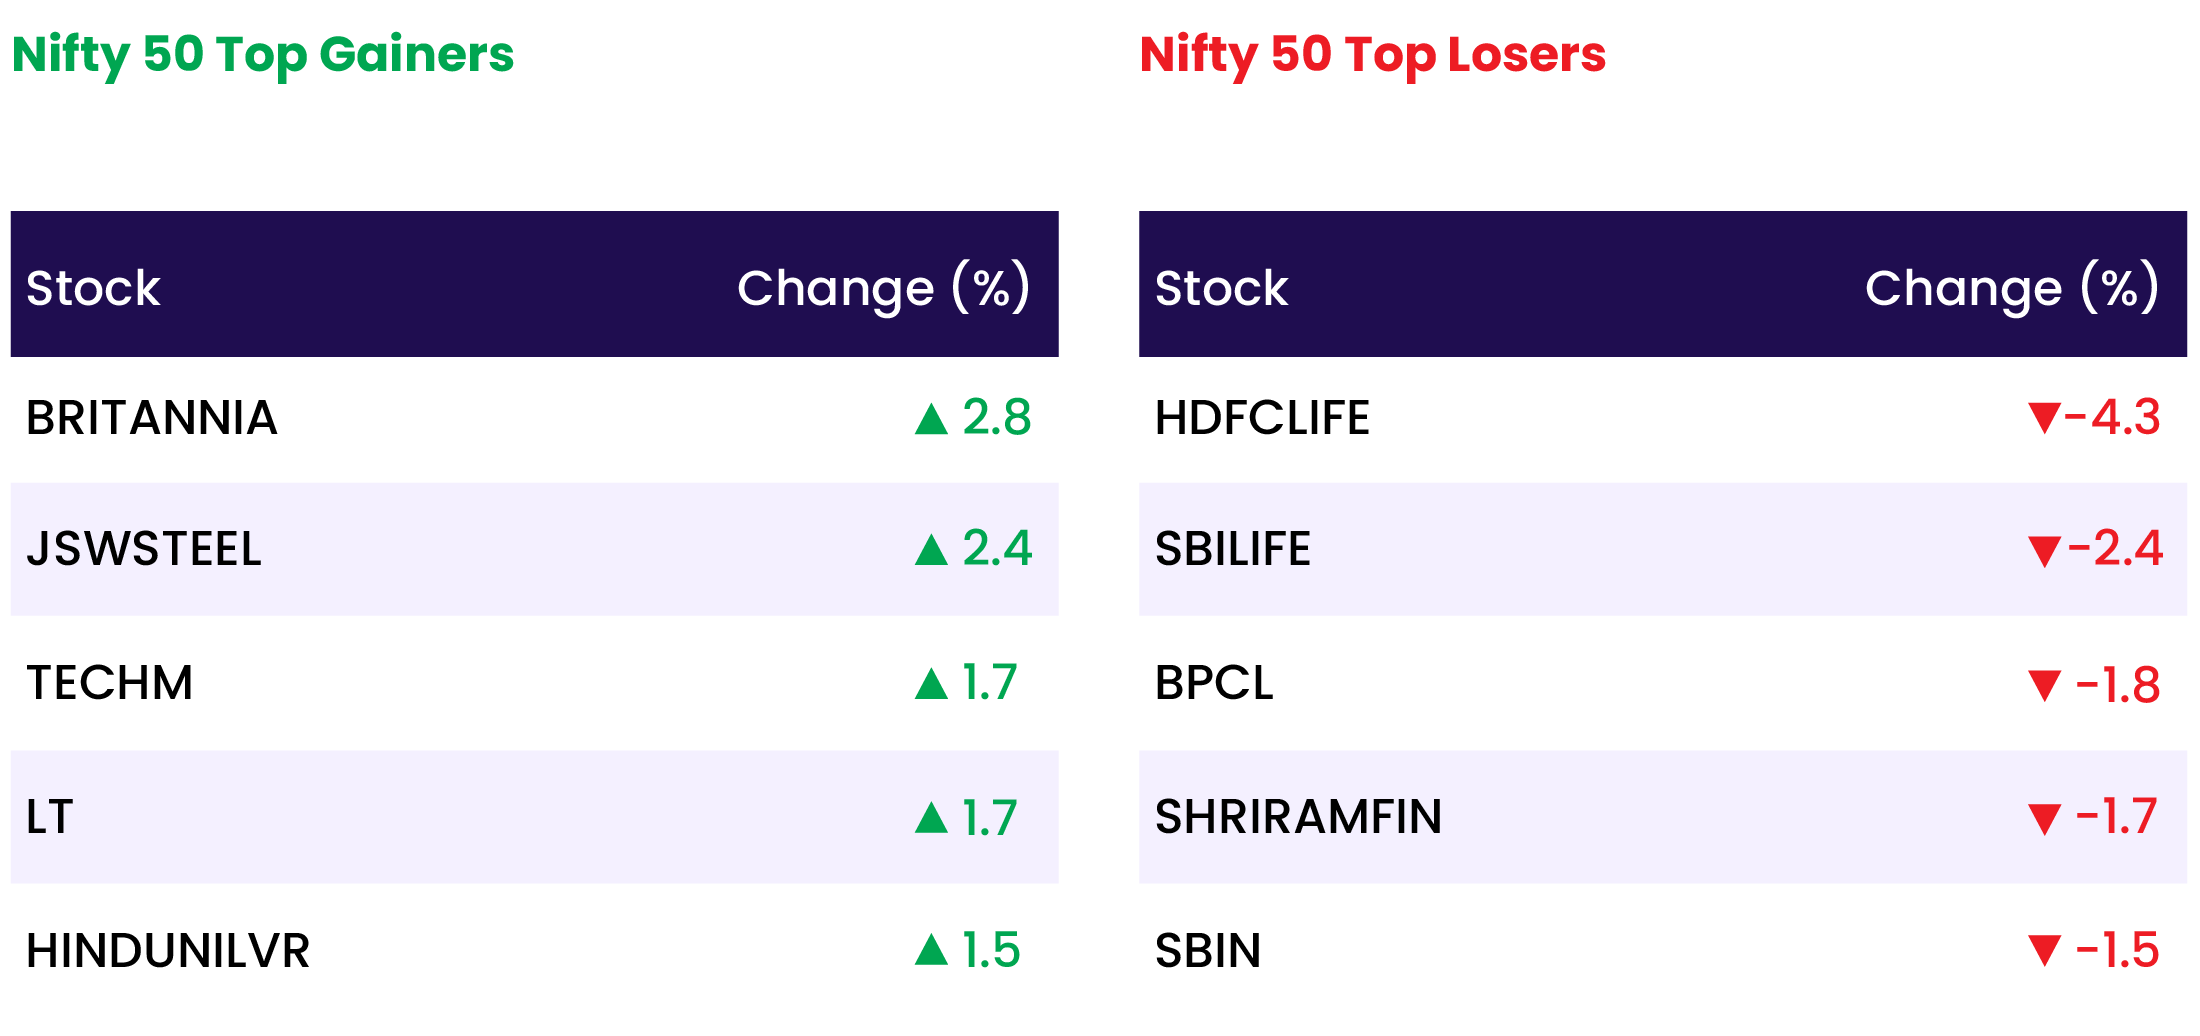
Daily Leader board:
Sectoral Performance
| Top Sectors | Day change (%) |
| NIFTY REALTY | 0.8 |
| NIFTY IT | 0.5 |
| NIFTY METAL | 0.3 |
| NIFTY MEDIA | 0.2 |
| NIFTY FMCG | 0.1 |
Advance Decline Ratio
| Advance/Declines | Day change (%) |
| Advances | 1592 |
| Decline | 2344 |
| Unchanged | 92 |
Numbers to track
| Indices Name | Latest | % 1D | % YTD |
| Dow Jones (US) | 38,703 | (2.6) % | 2.6 % |
| 10 Year Gsec India | 7.0 | 1.8 % | 14.1 % |
| WTI Crude (USD/bbl) | 73 | (0.8) % | 3.6 % |
| Gold (INR/10g) | 69,053 | 0.0 % | 3.1 % |
| USD/INR | 83.76 | 0.0 % | 0.9 % |
Please visit www.fisdom.com for a standard disclaimer

