Daily Snippets
Date: 18th October 2023 |
|
|
Technical Overview – Nifty 50 |
|
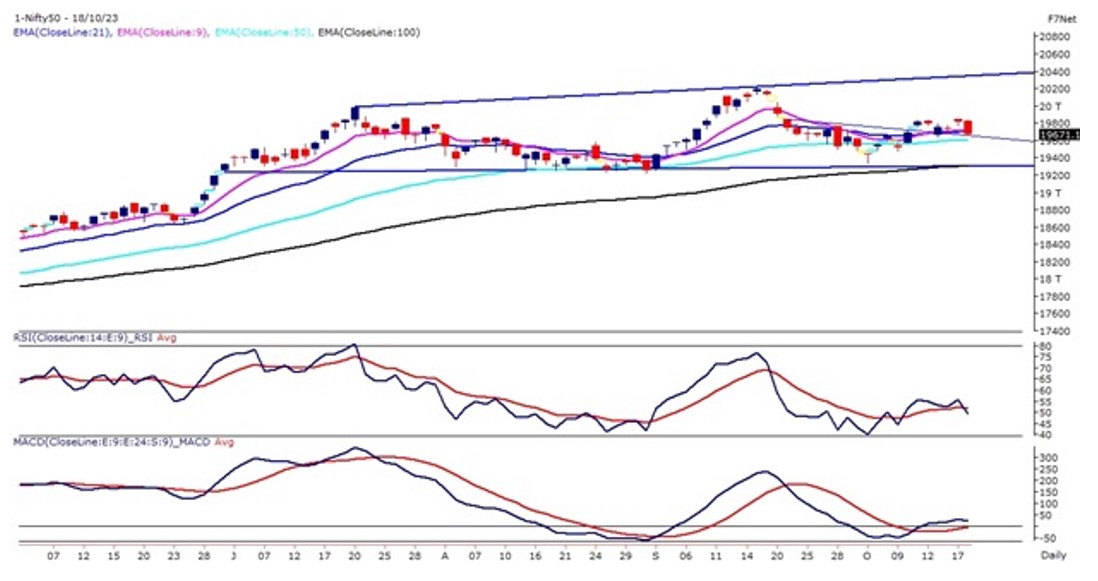
After showing up move with range-bound action on Wednesday, Nifty slipped into sharp weakness after breaching below 19,800 levels and continues to trade lower towards the closing. The Nifty has engulfed the previous two days’ candle and formed a tall bearish candle for the day.
The Benchmark index on the 60 mins chart has given a triangle pattern breakdown and prices are sustaining below the same. Due to a sudden sharp fall prices again drift near its 9 & 21 EMA on the daily scale. The momentum oscillator RSI (14) has faced resistance near 55 levels and is hooked down from them with a bearish crossover.
The volatility gauge indicator India VIX has sustained above 10.50 levels and has gained above 3 percent to date on the weekly chart. It has been the third time that prices have taken resistance near 19,850 levels and moved lower. The immediate resistance for the index is placed at 19,850 levels and the support stands near its 50 EMA which is placed at 19,600 levels.
|
Technical Overview – Bank Nifty |
|
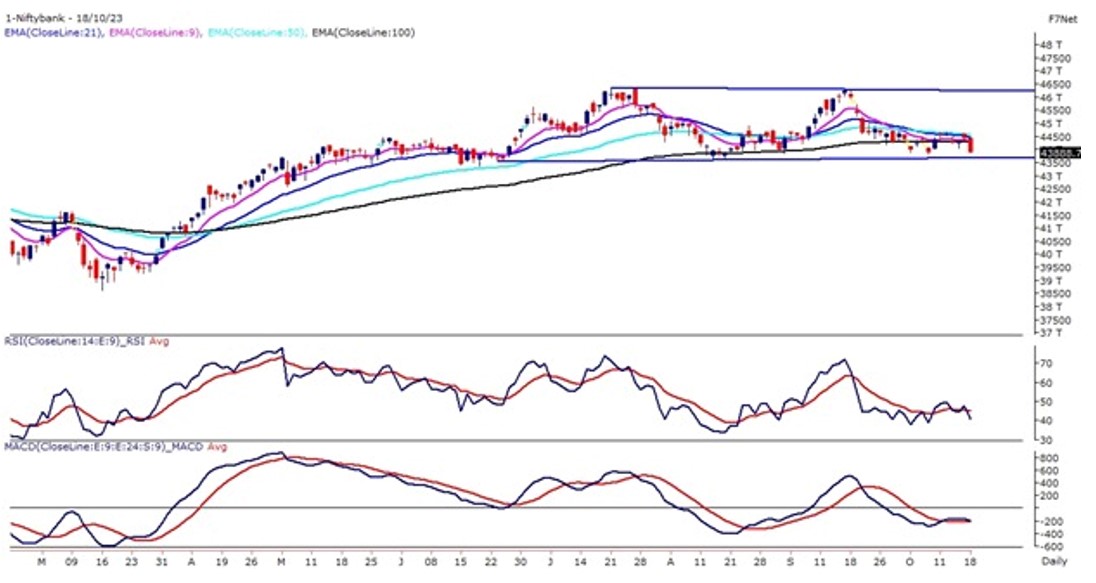
It was the Banking sector that underperformed the Benchmark index and witnessed a fall of more than 1% and formed a tall bearish candle on the daily time frame. The Banking index on the intraday chart has witnessed a rectangle pattern breakdown and prices are trading below the lower band of the pattern.
The Bank Nifty on the daily chart is trading in a rectangle pattern and prices have again reached near the lower band of the pattern. On the previous couple of occasions, prices have reversed from the lower levels but the rise has not been hiked more than 1000 points.
The momentum oscillator RSI (14) has faced resistance near 50 levels and the oscillator hooked near 40 levels with a bearish crossover on the cards. The index is trading below its 9, 21 & 50 EMA and the bias remains cautious for the time being. The immediate resistance for the index is placed at 44,400 levels and the support stands at 43,600 levels.
|
Indian markets:
- Domestic shares faced selling pressure on Wednesday, with most sectors experiencing losses.
- Sluggish global market trends, Middle East conflict and spike in Brent crude oil prices spoiled sentiment.
- The Nifty settled below the 19,700 level. Pharma and auto shares performed well, while banking and energy shares performed poorly.
- The midcap and smallcap indices also declined, mirroring weakness in the broader market.
|
Global Markets
- Markets in Europe declined across the board while Asian stocks ended mixed on Wednesday as a blast at a Gaza hospital dealt a blow to hopes for containing the crisis.
- Economic data from China showed stronger-than-expected growth. China posted 4.9% growth in the July to September quarter from a year earlier, according to a release from Chinas National Bureau of Statistics on Wednesday. However, this figure was lower than the 6.3% year-on-year expansion seen in the second quarter.
- US stocks closed near the flat line on Tuesday as investors analyzed the latest bond yield moves and the corporate earnings season gained steam.
|
Stocks in Spotlight
- Mazagon Dock gained 3.2 percent after the shipbuilder signed a deal with the defence ministry to build a training ship for the Indian Coast Guard (ICG) at a cost of Rs 310 crore. This dedicated training platform, equipped with advanced surveillance and monitoring systems, will prepare 70 Coast Guard and international trainee officers for the complexities of maritime Coast Guard life, enhancing coastal and offshore security.
- Private sector lender Bandhan Bank on October 18 reported a net profit of Rs 721.20 crore in the July–September quarter of the current financial year, up 244 percent YoY, from Rs 209.3 crore in the corresponding period last year.
- Wipro saw its revenue decline for the third consecutive quarter, coming in at $2.7 billion for the second quarter of the 2024 fiscal year, a fall of 2.3 percent sequentially, and 2 percent in constant currency. Last quarter, Wipro’s revenues declined 2.8 percent in constant currency terms, falling at the lower end of the company’s guidance for the quarter.
|
News from the IPO world🌐
- Blue Jet Healthcare IPO to open on October 25
- IRM Energy IPO, Retail portion fully booked within hours of opening
- ASK Automotive, ESAF Small Finance Bank, Cello World get Sebi approval for IPO launch
|
|
Day Leader Board
Nifty 50 Top Gainers | Stock | Change (%) | | CIPLA | ▲ 3.5 | | DRREDDY | ▲ 2.2 | | TATAMOTORS | ▲ 1.8 | | SUNPHARMA | ▲ 1.4 | | SBILIFE | ▲ 0.5 |
| Nifty 50 Top Losers | Stock | Change (%) | | BAJFINANCE | ▼ -3 | | BAJAJFINSV | ▼ -1.9 | | NTPC | ▼ -1.5 | | HDFCBANK | ▼ -1.4 | | RELIANCE | ▼ -1.4 |
| |
Sectoral Performance | Top Sectors | Day change (%) | | NIFTY PHARMA | 0.78 | | NIFTY HEALTHCARE INDEX | 0.43 | | NIFTY MEDIA | 0.27 | | NIFTY AUTO | 0.08 | | NIFTY FMCG | -0.42 |
|
Advance Decline Ratio | Advance/Declines | Day change (%) | | Advances | 1386 | | Declines | 2322 | | Unchanged | 135 |
|
Numbers to track | Indices Name | Latest | % 1D | % YTD | | Dow Jones (US) | 33,998 | 0.0 % | 2.6 % | | 10 Year Gsec India | 7.3 | 0.30% | 0.30% | | WTI Crude (USD/bbl) | 87 | 0.0 % | 12.6 % | | Gold (INR/10g) | 59,500 | 1.00% | 7.60% | | USD/INR | 83.23 | (0.1) % | 0.7 % |
|
|
Please visit www.fisdom.com for a standard disclaimer.
|

