Daily Snippets
Date: 03rd January 2024 |
|
|
Technical Overview – Nifty 50 |
|
Nifty continues to trade lower after forming a negative divergence on the daily time frame. The Index was hovering near 9 EMA on the daily chart and was finding support near the same.
Strictly speaking, if the last three days of trading action at Dalal Street are described with one word, that would be “volatility”. Well, this should not come as any surprise amidst overbought technical conditions. Interestingly, Nifty Bulls have panicked after Nifty scaled a new all-time-high at the 21,834.35 mark in yesterday’s trade.
The Nifty50 on the daily chart is trading within the rising channel pattern and prices have presently reached near the upper band of the pattern and have formed 2 bearish candles on the daily chart.
Some profit bookings at the current level cannot be ruled out due to overbought conditions. The immediate support for the Index is placed at 21,400 – 21,350 levels and the upside is capped near 21,800 levels.
|
Technical Overview – Bank Nifty |
|
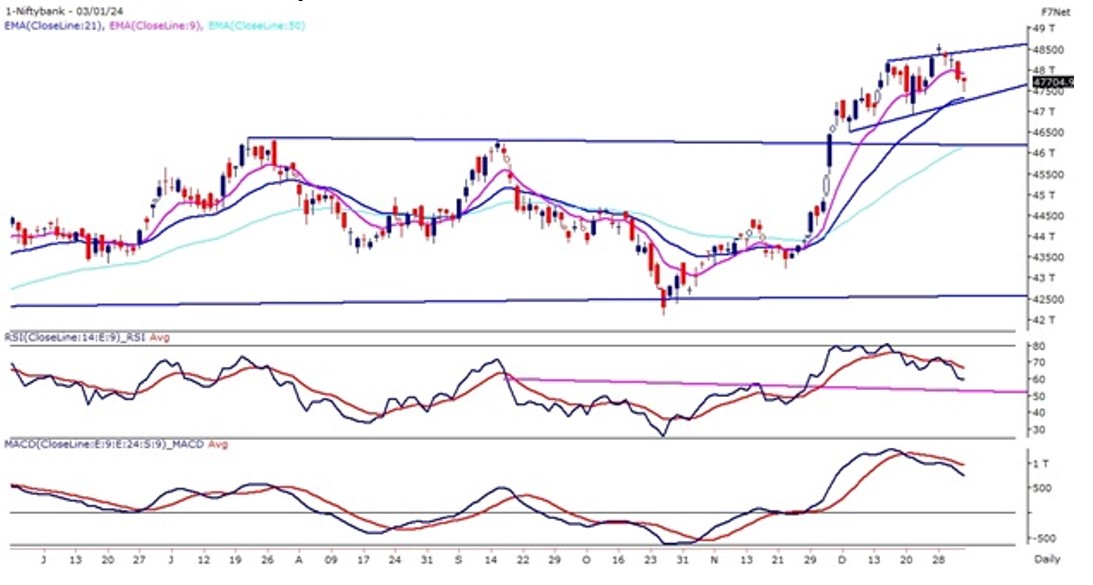
It was a bearish to sideways trading session for the Banking index where prices continued to trade below its 9 EMA which is placed at 47,890 levels. The Bank Nifty has formed a consecutive bearish candle on the daily chart indicating profit booking.
The Bank Nifty on 60 mins charts has given a rising channel pattern breakdown and prices are trading below the lower band of the range. The momentum oscillator RSI (14) is reading near 60 levels and has formed a bearish divergence where prices have made a new high but the oscillator rejected to do so. The immediate support for the Index is placed at 47,500 – 47,300 levels and the upside is capped near 48,200 levels.
|
Indian markets:
- Domestic equity indices fell for a second consecutive day, with the Nifty closing below 21,550, driven by declines in IT and metal shares.
- Conversely, realty, PSU banks, and pharma shares saw gains amid cautious sentiment linked to the upcoming third-quarter earnings season and a lack of new catalysts, coupled with worries about overvalued stocks.
- Worries about global economic recovery in 2024 surfaced due to weak indications from China and the Eurozone.
- Investors keenly awaited the US Fed minutes for possible hints regarding future interest rate changes.
|
Global Markets
- Markets in Europe and Asia dropped on Wednesday as investors processed important economic data. The initial market positivity driven by expectations of early interest rate cuts from central banks diminished in light of underwhelming economic indicators.
- Traders are eagerly anticipating the release of the Federal Reserves meeting minutes later on Wednesday, which will provide insight into the central banks perspective on potential monetary easing.
- US stocks retreated Tuesday, setting Wall Street up for a downbeat start to 2024 after a winning year that left the S&P 500 just short of a new record high. Tech stocks lost ground after Barclays analysts downgraded their rating on Apples stock, citing concerns about demand for new iPhones.
- Apple shares dropped on Tuesday, after Barclays cut the iPhone maker?s rating to underweight and trimmed its price target to $160 from $161.
- The U.S. manufacturing sector shrank more than expected in December, according to a new purchasing manager?s index from S&P Global. The Manufacturing PMI came in at 47.9 in December, down from 49.4 in November.
- Market focus is now on the Fed minutes for the December policy meeting due later in the day. The ISM survey on U.S. manufacturing is also due later on Wednesday, as well as job openings data, before a private payrolls report and jobless claims results on Thursday. The closely watched U.S. nonfarm payrolls report is due on Friday.
|
Stocks in Spotlight
- The shares of Adani Group saw a surge after the Supreme Court dismissed the company’s petition claiming a conflict of interest against the panel. The panel was set up by the court in March 2023 to look into the allegations made in the Hindenburg report. Several Adani companies, including Adani Energy Solutions, Adani Total Gas, Adani Green Energy, Adani Power, Adani Wilmar, Adani Enterprises, and Adani Ports and Special Economic Zone (APSEZ), witnessed a rise in their shares, ranging from 2% to 11%.
- Shares of Ircon International and RITES surged by over 5% each on January 3 following recent management changes. IRCON disclosed that Pramod Kumar Singh and Ravi Sahay ceased to be senior management personnel due to reaching the age of superannuation. Meanwhile, RITES witnessed a similar jump after Manobendra Ghoshal, the chief strategy officer, left to assume the role of chairman and managing director at MSTC Limited, consequently stepping down from the senior management at RITES.
- Coal India were trading in the red, falling around two percent in January 3 despite the state-owned company supplying an all-time high volume of 98 million tonnes (mts) to non-regulated sector (NRS) consumers till December.
- Compared to the the year-ago period, the supply is up 23 mts or 31 percent more than over 75 mts.
|
News from the IPO world🌐
- Shri Balaji Valve Components lists at Rs. 190 at a premium of 90%.
- IPOs to wathcout in 2024: Swiggy, firstcry, Ola Electric, Oyo, Portea Medical.
- Of the 57 IPOs in 2023, 41 received mega response of more than 10 times.
|
|
Day Leader Board
Nifty 50 Top Gainers | Stock | Change (%) | | BAJAJ-AUTO | ▲ 4.6 | | ADANIENT | ▲ 2.5 | | ADANIPORTS | ▲ 1.6 | | CIPLA | ▲ 1.6 | | ITC | ▲ 1.5 |
| Nifty 50 Top Losers | Stock | Change (%) | | HINDALCO | ▼ -3.8 | | JSWSTEEL | ▼ -3.8 | | TATASTEEL | ▼ -3.3 | | LTIM | ▼ -3 | | TECHM | ▼ -2.9 |
| |
Sectoral Performance | Top Sectors | Day change (%) | | NIFTY REALTY | 1.23 | | NIFTY PSU BANK | 1.15 | | NIFTY PHARMA | 0.61 | | NIFTY HEALTHCARE INDEX | 0.59 | | NIFTY OIL & GAS | 0.55 |
|
Advance Decline Ratio | Advance/Declines | Day change (%) | | Advances | 2137 | | Declines | 1706 | | Unchanged | 102 |
|
Numbers to track | Indices Name | Latest | % 1D | % YTD | | Dow Jones (US) | 37,715 | 0.1 % | 0.0 % | | 10 Year Gsec India | 7.2 | 0.10% | 0.60% | | WTI Crude (USD/bbl) | 70 | (1.8) % | 0.0 % | | Gold (INR/10g) | 63,039 | 0.10% | 0.10% | | USD/INR | 83.2 | 0.2 % | 0.2 % |
|
|
Please visit www.fisdom.com for a standard disclaimer.
|
