News outlets are abuzz with headlines about Nifty & Sensex being at all-time highs, the street is euphoric, everyone seems to be making money. Meanwhile, are you simply wondering why hasn’t your portfolio reached “all-time highs”?
This edition is to help you decode the mystery behind zooming indices and not-so-zooming portfolios.
Back to Basics
Nifty & Sensex are bellwether indices that reflect the indicative state of capital markets. But, it is important to understand that Nifty is simply a basket of shares of the largest 50 listed companies in India.
To put things in perspective, Indian capital markets have ~4,900 listed stocks and Nifty 50 reflects only 1% of the total universe (and sensex even lower at 30 companies) – that too only shares of the most blue-chip companies in India. So essentially when people say that the indices have sky-rocketed, it is implied that the share prices of only the top 1% of the listed space have increased.
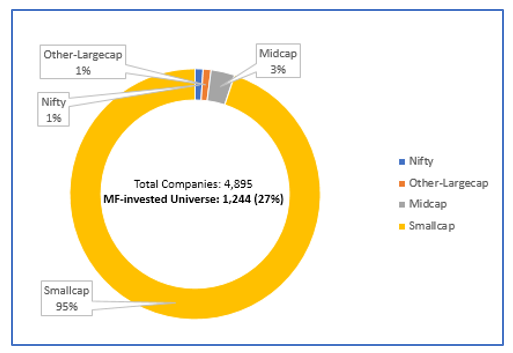
However, the Indian mutual fund industry has invested across 1,244 companies’ shares which accounts to almost 27% of the listed universe.
It is therefore implied that the average diversification of pure equity mutual funds is much beyond Sensex’s 30 or even Nifty’s basket 50 and so can extract value, generate returns and diversify your investment simultaneously to offer optimal performance at all points in time.
How are indices doing so well, then?
While judging the capital markets by looking at indices in isolation is ignorance to a good extent, looking at indices as a whole is only a step further in the same direction.
As a matter of fact, only the top-ten performers of NIFTY (constitutes 20% of the basket) contributed to almost 80% of the uptick in the index’s performance last year. Pareto’s 80:20 theory seems to be playing out for indices as well.
Below is an illustration of Nifty’s top-ten performing stocks, returns generated & contribution to Nifty’s overall rise.
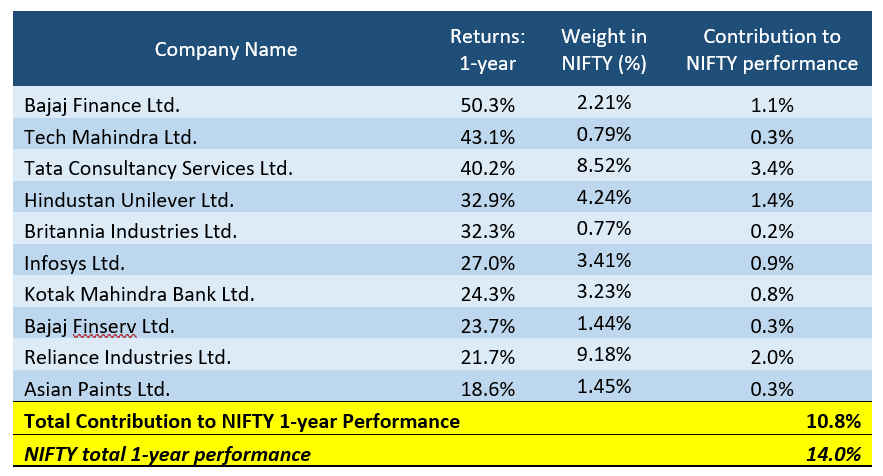
As observable, even Nifty has not been robust as an entire basket – only a handful stocks with meaningful representation in the index portfolio pushed the weighted-average return towards the higher-side while the high-quality, MF-invested universe outside this still seems to be only at the cusp of a turnaround in general.
Is passive worth a shot?
Now, for those still wondering if passive investing (investing in funds tracking the index) is worth a shot then, the below illustration attempts to clarify how actively managed mutual funds perform vis-à-vis indices in the long term.
Illustration: Growth of INR 5,000 SIP for the period 1 Jan’99 to 31 Dec’18 (~20 years)
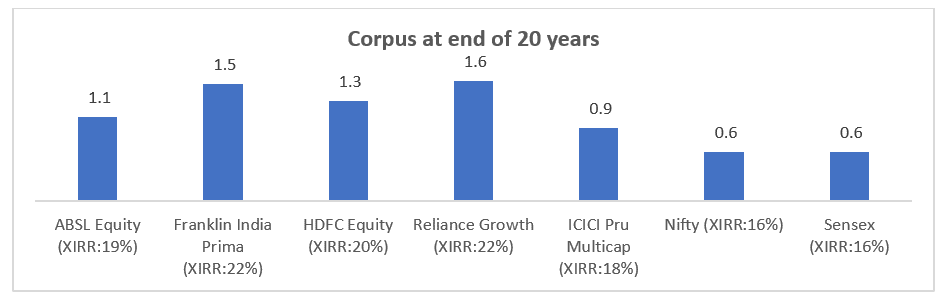
(Mutual Funds (all regular, growth) selected for comparison may or may not be the top-rated funds and are selected purely on the basis of vintage for the sake of data availability and standard comparability)
One must realize that index funds definitely deserve an allocation in portfolios but more from an allocation, diversification & hedging perspective than as a core, alpha-generating portfolio.
One key takeaway from the above illustrations and the explanation above is that indices are representative of the economic health in terms of capital market buoyancy and must not be construed as a solid indicator of value proposition offered by India Inc. as a whole.
If you have any concern, please write to us at ask@fisdom.com or call at +918048039999 , we would be happy to answer your query.