What is index of industrial production data (IIP)?
IIP measures the industrial production on a monthly basis, highlighting state of 3 growth driving verticals. It is a key indicator of the manufacturing sector of the economy.
Its Economy based are as follows:

Its Use based are as follows:

What does IIP Index data mean for Financial Markets?
It serves as an indicator of corporate earnings, influencing equity & debt investors alike.
It is also a good parameter to understand the industrial activity in the country.
IIP Reading – November 2020
What is the latest reading?
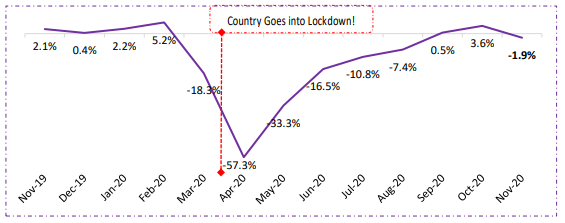
IIP contracts by 1.9% in Nov’20 vs growth of 3.6% in Oct’20 and 2.1% in Nov’19 .
Investor Takeaway
IIP recorded leakage in growth after 2 consecutive months of expansion, with growth rate touching an 8-month high in month prior. Highest IIP in CY20 was in Feb’20 when IIP grew by 5.2%.
The fall in IIP can be attributed to declines seen in manufacturing & mining sectors.
IIP during April -November 2020 recorded contraction of 15.5% from year ago period, as disaggregated data continues to question sustainability in recovery in very near periods.
Element Trajectory
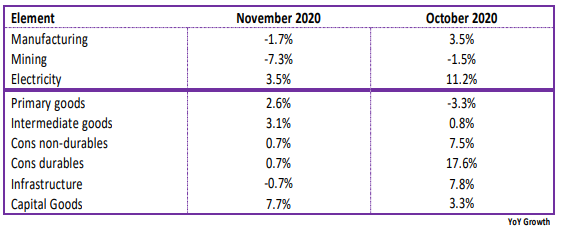
Revival of demand and consumption took a big dent as is reflected in dampened consumer durables, non-durables and electricity elements.
Consumer durables is the only production element to surpass its pre-covid levels.
Capital goods (indicating investments) — maintained its growth trajectory for 2nd straight month after 21 months of contraction.
Even after recording positive growth, said element is sitting 12.5%+ below its pre-covid level.
Manufacturing has enjoyed a uphill climb with its peers in contact-intensive services, such as hospitality, transport and tourism yet to see signs of green shoots. The next 2-3 months will be pivotal in charting country’s production health & wealth and build confidence into commentary on the upside.
Click here If you want to read the complete IIP Index press release


