
Insights From Samvat 2079 And Outlook For Samvat 2080
Unveils a story of resilience, challenges, and opportunities
In the realm of finance, Samvat 2079 painted a picture marked by noticeable ups and downs, a complex interplay of global and domestic stocks. Despite the roller-coaster ride of market dynamics, the broader segments of the market made a strong comeback from the low point in March 2023, driven by growing confidence in the overall economy. Among these, Small and Midcap stocks took the spotlight, showing impressive growth rates of 22% and 27%, respectively, over the year.
However, while the Nifty index may have seemed slower than other popular indices, it had its moment of glory by crossing the 20,000 mark in September 2023, only to experience a dip below 19,000 in October. Interestingly, despite challenges like rising global bond yields, concerns about inflation, and high overnight interest rates, the overall market still looks relatively positive. Despite these difficulties, India has shown impressive resilience compared to other developed and emerging market countries. This resilience is due to strong domestic investments, particularly through SIPs, a healthy overall economic environment, and limited outflows from foreign investors. These factors have helped India weather the storms of the past year.
Turning our attention to different types of asset classes, it’s like a game of musical chairs with assets constantly taking turns in the spotlight. In 2022, gold emerged as the star player, mainly due to worries about world events and a topsy-turvy stock and bond market. This year, the Indian market has significantly outperformed other emerging markets, making it the standout asset class. In this financial landscape, equities, as an asset class, remain the all-time favourite, continuing to perform remarkably well.
In the financial world of Samvat 2080, it seems we’re in for a bit more uncertainty before things become clearer, and this transition might take some time. What’s causing the market’s ups and downs are the big economic factors. We’re grappling with challenges like the direction of rising oil prices, increasing interest rates on bonds, changes in the strength of the dollar, and how global tensions are evolving. Additionally, current market valuations don’t offer much room for further expansion. The key to driving market returns in the future is an increase in corporate earnings. We maintain a positive outlook on stocks for the long term, specifically over 3 to 5 years and beyond However, it’s worth acknowledging that we may encounter short-term volatility along the way.
Overall, India is shifting its focus from being a consumer-driven economy to one that’s more about producing things, particularly with the help of initiatives like the Production-Linked Incentive (PLI) scheme and substantial investments. This change, combined with a robust economic foundation, has the potential to accelerate economic growth.
To navigate 2023 successfully, it’s vital to make wise decisions about where to invest and when to shift your focus among different industries. Investors should refine their strategies for diversifying their investments across various asset classes and leverage market fluctuations to build long-term positions.
Looking back, we are generally content with the performance of our Diwali picks from Samvat 2079. However, we acknowledge that there were certain selections that, in hindsight, could have been better.
Diwali Picks SAMVAT 2079 (Last Year)
Performance Table
| Company Name | Entry | Target Price | Target Date | Target % | High | High % |
| Ambuja Cements Ltd. | 508 | 720 | – | – | 598 | 17.80% |
| Tata Chemicals Ltd. | 1,166 | 1,360 | – | – | 1,200 | 2.90% |
| Zee Entertainment Enterprises Ltd. | 271 | 400 | – | – | 291 | 7.30% |
| ICICI Bank Ltd. | 897 | 1,030 | – | – | 1,009 | 12.50% |
| The Federal Bank Ltd. | 132 | 185 | – | – | 153 | 15.30% |
| HCL Technologies Ltd. | 1,009 | 1,150 | 18-Sep-23 | 29.90% | 1,311 | 29.90% |
| Titan Company Ltd. | 2,641 | 2,800 | 18-Sep-23 | 26.90% | 3,351 | 26.90% |
In the face of pronounced volatility and amidst global uncertainties, our Diwali picks have demonstrated remarkable resilience and delivered strong performance.
Diwali Picks SAMVAT 2080
Unlocking Investment Opportunities For The Next Year
| Company Name | Sector | LTP* | Target Price | % Upside | Support Range | Comment |
| Tata Motors Ltd. | Automobile | 647 | 750 | 16% | 550-525 | Add on a dip to 600 |
| Torrent Power Ltd. | Power | 744 | 850 | 14% | 625-595 | Add on a dip to 700 |
| DLF Ltd. | Realty | 595 | 715 | 20% | 475-450 | Add on a dip to 545 |
| Dr Reddy’s Laboratories Ltd. | Pharmaceuticals | 5263 | 6300 | 20% | 4700-4650 | Add on a dip to 5000 |
| PNB Housing Finance Ltd. | Banking & Finance | 730 | 900 | 23% | 598-580 | Add on a dip to 675 |
| IDBI Bank Ltd. | Banking & Finance | 62 | 75 | 21% | 53-52 | Add on a dip to 56 |
*As On 03rd November 2023 Closing
1. Tata Motors Ltd
Strong FY24 Commencement and Promising Growth Strategies
Technical Rationale:
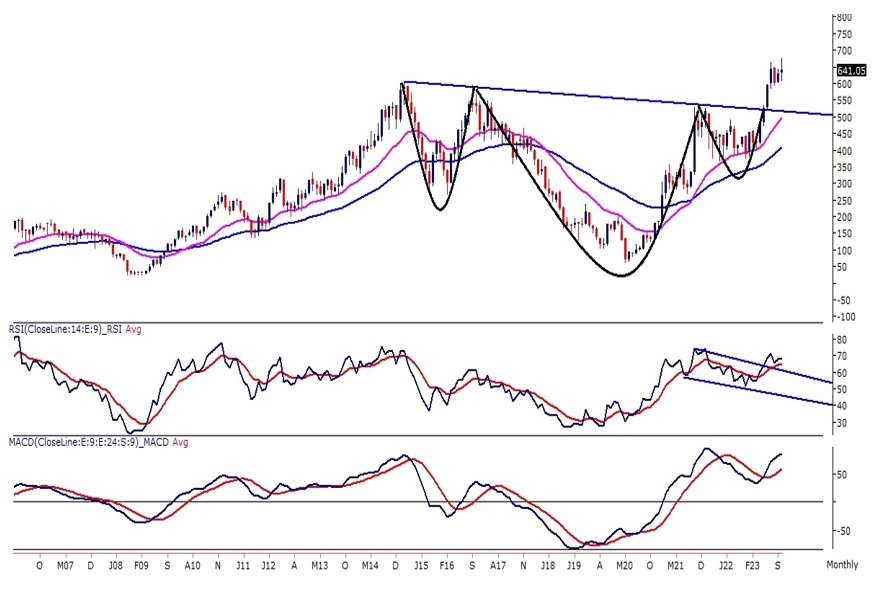
- Over the past eight years, Tata Motors’ monthly price chart has shown an inverted head and shoulder pattern, with a recent breakout. The MACD indicates a bullish trend, and the RSI (14) stands at 65, affirming positivity. Prices remain above the 21 and 50 exponential moving averages.
- Oscillators suggest a ‘buy-on-dip’ approach. A critical support level at 550 – 525 bolsters the bullish case, and potential upside targets lie at uncharted levels of 710 and 750, driven by the breakout and continued upward momentum
Fundamental Rationale:
- We are satisfied with the strong start to FY24, indicating a positive beginning for the financial year.
- The company has effectively focused on distinct business strategies employed across automotive verticals, which are consistently yielding positive results. These strategies are not only delivering short-term results but also contributing to the long-term structural strength of the business. This suggests a sustainable growth trajectory.
- We have seen a promising start for the CV segment. Government infrastructure initiatives & and increased economic activity are the key reasons for the same. We expect this momentum to continue for the rest of the financial year.
- JLR’s leadership reports a third consecutive quarter of improved financial performance, highlighting record production levels and cash flow. This underscores the successful execution of their Reimagine strategy.
| Outlook: Despite challenges such as high interest rates, fuel price fluctuations, and inflation, we maintain an optimistic outlook for the demand environment. The company is set to continue its demand-driven strategy to enhance competitiveness throughout the year. Q1FY24 earnings mark a strong start to the fiscal year, with all automotive segments performing well. We are confident in sustaining this positive momentum throughout the year and achieving our objectives. Cost-saving initiatives, particularly within the JLR segment, along with improvements in the chip shortage situation and a favourable product mix, are expected to be key drivers of our success. |
|
2. Torrent Power Ltd
Seizing Opportunities in Surging Energy Demand
Technical Rationale:
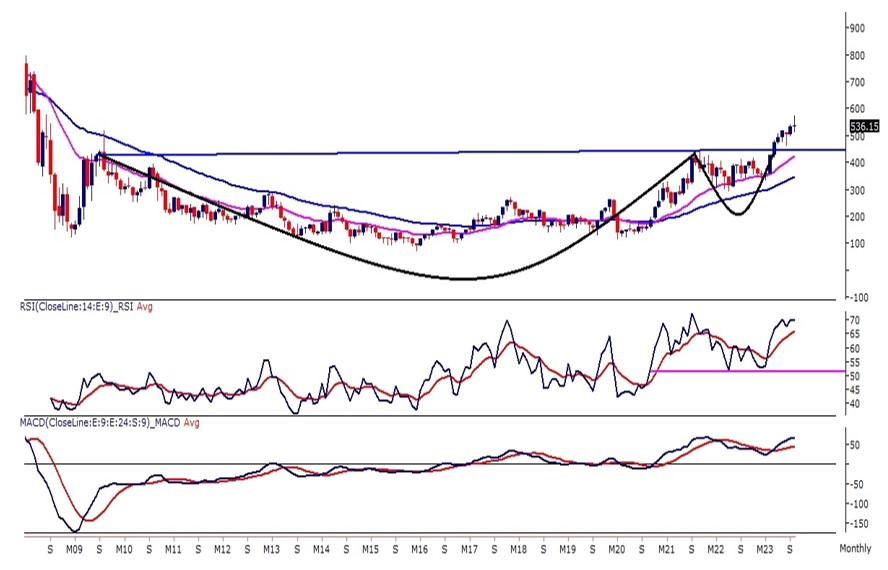
- Torrent Power surged from 396 to 606 levels, yielding a 60% return in 12 months. After 18 months of consolidation, it broke out from a bullish rectangle pattern on the monthly chart.
- Prices stay above the 21-day exponential moving average, and most indicators signal a bullish trend. Strong buying support exists at 625 – 595 levels, with potential targets around 785 and 850, based on the breakout and anticipated upward trend.
Fundamental Rationale:
- Over the last two years, we’ve seen a consistent and strong increase in the demand for energy. In the fiscal year 2022, the demand surged by 8%, followed by another significant increase of 9.5% in the fiscal year 2023. What’s noteworthy is that even with this high starting point, the demand for power continues to grow steadily, with the peak demand level increasing each year.
- If the current trend of increasing power demand persists, coupled with Central Electricity Authority (CEA) forecasts, we anticipate more frequent peak power shortages and rising electricity costs. This issue stems from a supply-demand gap. To tackle this challenge, the government is actively enhancing capital investments in the thermal energy sector.
- Considering these developments, Torrent Power is well-positioned to benefit from this transition. Their thermal generation business has experienced an increase in Plant Load Factor (PLF) due to growing demand from long-term power buyers and the merchant power market. In Q1FY24, this segment contributed an impressive Rs. 60 crores to Torrent Power’s overall financial performance.
- During this period, Torrent Power successfully secured tenders for approximately 920 MW in merchant power sales from NVVN, highlighting their competitive edge and paving the way for future growth in thermal generation. This positive outlook is reinforced by the company’s solid finances, strong distribution, and expected improvements in generating unit performance.
| Outlook: The increasing energy demand presents challenges and opportunities. The government’s capital investment focus to address demand growth is crucial. Torrent Power is well-prepared to benefit from this transition, with its strong thermal generation business, recent success in securing merchant power tenders, and solid financial position, poised for growth in the energy sector. |
|
3. DLF Ltd
A Story Of Strong & Consistent Financial Performance & Strategic Focus
Technical Rationale:
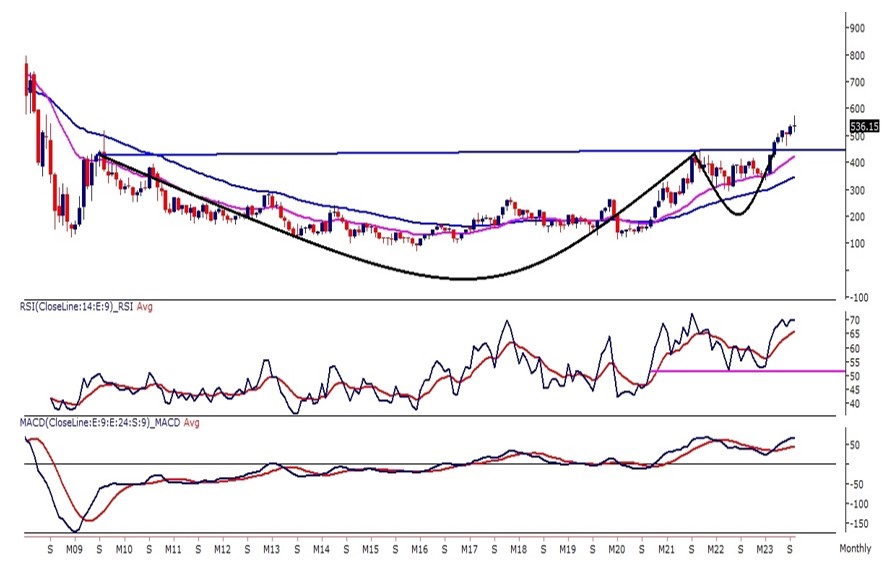
- DLF has been in a multi-year rounding bottom pattern for over a decade, with trend line resistance at 450 on the monthly chart. A bullish cup-and-handle pattern breakout on the monthly chart has prices trading above the upper pattern band, accompanied by above-average volumes, indicating a robust breakout. Prices have retraced near the 450-trend line resistance, now serving as support.
- The momentum oscillator RSI (14) resides in a bullish range shift zone, above the horizontal trend line support at 52, currently near 70 with a potential bullish crossover. Consider entry at current levels and on dips around 545, with support at 475 – 450 and upside potential to 700-715 levels.
Fundamental Rationale:
- The company has consistently demonstrated a strong and reliable financial performance in recent years, with notable year-over-year growth in sales bookings, EBITDA, and PAT. Their impressive gross margin of 57% reflects their effective cost management and pricing strategies.
- Moreover, DLF has proactively strengthened its financial position by reducing debt and maintaining a healthy cash surplus of Rs. 142 crores in Q2FY24. Their strategic focus on cash flow generation through new product introductions and efficient inventory management bodes well for long-term financial stability and growth. Their commitment to debt reduction is evident from the complete elimination of outstanding debt from the previous quarter, setting the stage for a potential year-end cash surplus that is appealing to investors.
- Additionally, DLF’s entry into new markets, like Mumbai, is commendable. Their collaboration with Trident Buildtech for a Mumbai residential project offers promising profit potential. Furthermore, their expanding product range and strong double-digit rental growth from organic and new developments bolster their positive outlook.
- Planned launches for the current fiscal year are progressing as scheduled, instilling confidence in the company’s growth trajectory. The new retail pipeline is also on track, fostering optimism about the retail segment’s growth. DLF’s identified pipeline of new product launches now stands at an impressive 41 million square feet, signifying a robust strategy for future growth.
| Outlook: We maintain a positive outlook on the housing market with sustained demand. DLF’s strong financial performance, proactive debt reduction, strategic market expansion, and a robust pipeline of new products position the company for continued growth and profitability. With a promising trajectory, DLF stands as a strong player in the real estate sector. |
|
4. Dr Reddy’s Laboratories Ltd
Quarterly Triumph, Global Growth, and Biosimilar Strategy
- The company has leveraged its positive trajectory to achieve an exceptional financial quarter, marked by record-breaking sales and profitability. This success results from the increasing popularity of their products and expansion into new regions. Their improved operational efficiency in these areas has bolstered their profit margins.
- The global business is on an upward trajectory, with North America experiencing a notable 9% sales growth. This growth was largely driven by increased market share in key product categories and successful new product launches during the quarter. Similarly, in Europe, the company achieved a substantial 12% year-over-year growth in sales, with new product launches making a significant contribution.
- In contrast, the growth in India and Emerging Markets (EM) was modest. India’s business saw a 3% year-over-year growth, but the company is focusing on introducing innovative new products and enhancing its generic product segment to target double-digit growth in FY24. This suggests the potential for more substantial growth soon.
- Currently, the company’s main biosimilar focus is on emerging markets, specifically Rituximab in India and Russia. They are actively expanding their efforts, with plans to launch around five Phase-III biosimilars globally, including the United States, over the next two years. The major biosimilar expansion is expected to take place starting from FY27.
| Outlook: We are confident that the company’s approach, involving investments in diverse businesses and launching new products in the US and Europe, holds the potential for sustained long-term growth. Additionally, their strategy to expand the global reach of Biosimilars to new markets is set to further catalyze this growth. |
|
5. PNB Housing Finance Ltd.
Solid Finances, Positive Ratings, and Expanding Retail and Affordable Housing Focus
Technical Rationale:
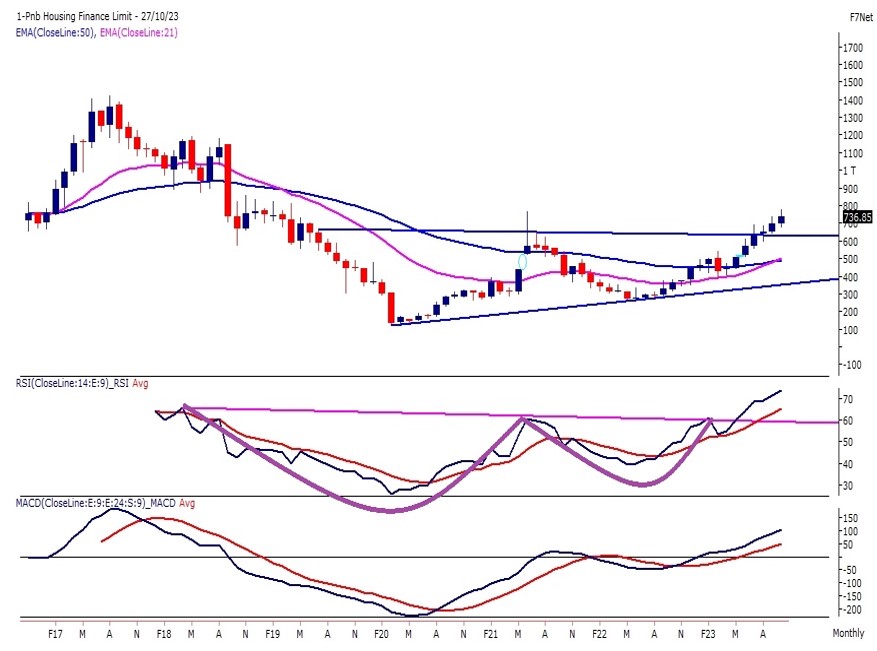
- PNB Housing Finance has recently broken out of an ascending triangle pattern with strong volumes on the monthly chart, indicating a bullish trend. A golden cross has formed as the 21-month exponential moving average crossed above the 50-month average, and the RSI (14) shows a bullish cup and handle pattern breakout.
- The MACD indicator also signals a bullish trend. Consider entry at current levels and on dips near 675, with potential targets at 860 – 900 levels.
Fundamental Rationale:
- The company has reported strong financial figures across the board, excelling in disbursement, growth, margins, asset quality, and profitability. Their Profit After Tax (PAT) increased by an impressive 46% year-on-year (YoY), accompanied by a substantial 16% growth in overall disbursements. Both Gross Non-Performing Assets (GNPA) and Net Non-Performing Assets (NNPA) decreased to 1.78% and 1.19%, respectively, from the previous quarter’s 3.76% and 2.59%
- The company’s robust fundamentals caught the attention of major rating agencies. In Q2 of FY ’24, CRISIL and ICRA upgraded the company’s outlook from stable to positive, while CARE also revised its outlook to positive during the same quarter.
- We’ve also observed a noteworthy trend in the September 2023 quarter, with increased Foreign Portfolio Investor (FPI) and institutional holdings.
- The company’s strategic shift to lower ticket sizes, with a focus on the retail sector, has proved fruitful. This tactical adjustment is evident in the reasonable growth of the retail segment, supported by an 18% year-on-year (YoY) surge in disbursements. As a result, the retail segment’s contribution to the loan portfolio has increased to 96%, up from 90% in September 2022.
- The affordable loans segment, which falls under the retail loans category and is less than a year old, is displaying a robust growth trajectory. Disbursements in this segment have risen significantly, from Rs. 137 crore in Q4FY23 to Rs. 374 crore in Q2FY24.
| Outlook: The company’s strong financial performance, marked by significant growth in PAT and disbursements, suggests a positive outlook. Positive assessments from rating agencies and increased institutional investments reflect growing confidence. Strategic shifts towards retail lending and affordable loans have proven successful, with the expanding retail segment showing promise. These developments position the company for continued growth and success in the future. |
|
6. IDBI Bank Ltd.
Bank’s Strong Financial Performance and Asset Quality Recovery
Technical Rationale:
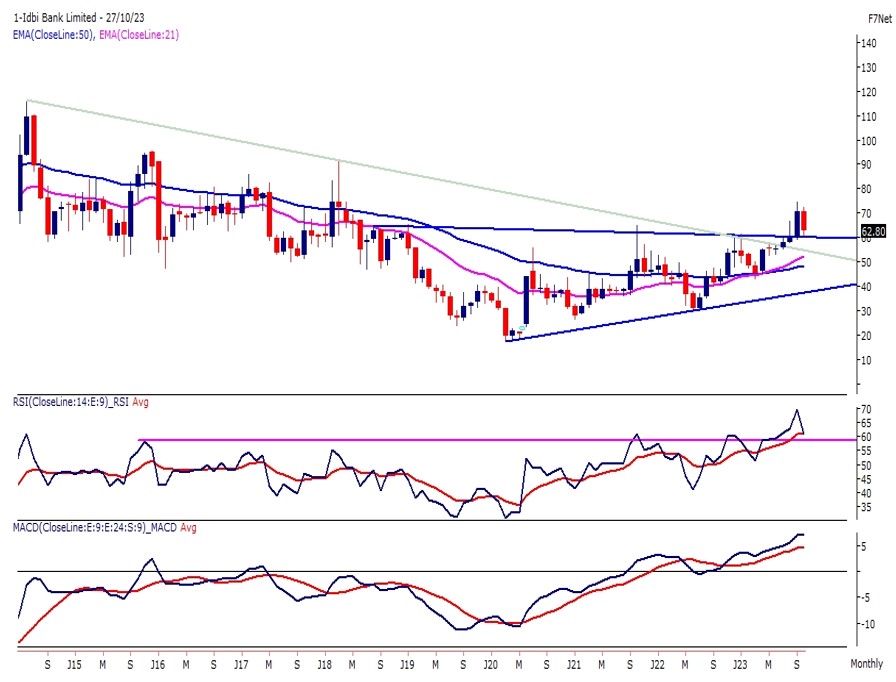
- IDBI Bank’s price broke out from an ascending triangle pattern in October with strong volumes. A golden cross of the 21-month EMA over the 50-month average occurred. RSI (14) shows higher lows and a breakout, while the MACD indicator is trending upward with a bullish crossover.
- Consider entry at current levels or near 57, with support at 54 – 52.50 and potential upside targets of 72 – 75.
Fundamental Rationale:
- The bank has posted impressive financial results, with both Profits After Tax (PAT) and Profit Before Tax (PBT) showing a remarkable 60% year-on-year (YoY) growth, along with a healthy YoY increase of 12% in Net Interest Income (NII).
- One noteworthy highlight is the bank’s asset quality, which, despite a slight dip in Q1FY24, has displayed a significant recovery. The Gross Non-Performing Assets (NPA) witnessed a substantial improvement, decreasing by 1161 basis points (bps) YoY and 15 bps quarter-on-quarter (QoQ) to settle at 4.90%. This recovery underscores the bank’s effective strategies in managing non-performing assets, signifying its commitment to financial stability and delivering positive news for investors.
- While disinvestment is not expected in the current year, it is likely to progress in the next calendar year, potentially unlocking value for the bank.
- Furthermore, the September 2023 quarter revealed a notable trend with increased Mutual Fund (MF) Holdings, Foreign Portfolio Investor (FPI) interest, and institutional holdings.
| Outlook: The recent correction in the stock is partly linked to the offloading of bad loans. This may have a negative impact in the short term as banks may incur losses on these loans. However, from a future perspective, this move can benefit the bank by cleaning up its balance sheet and reducing the burden of non-performing assets. Such positive actions contribute to the bank’s overall financial health and long-term profitability. |
|
Disclaimer: This document is not for public distribution and is meant solely for the personal information of the authorized recipient. No part of the information must be altered, transmitted, copied, distributed, or reproduced in any form to any other person. Persons into whose possession this document may come are required to observe these restrictions. This document is for general information purposes only and does not constitute investment advice or an offer to sell or solicitation of an offer to buy/sell any security and is not intended for distribution in countries where distribution of such material is subject to licensing, registration, or other legal requirements. The information, opinions, and views contained in this document are as per prevailing conditions and are of the date appearing on this material only and are subject to change. No reliance may be placed for any purpose on the information in this document or its completeness. Neither Finwizard Technology Private Limited (“Fisdom”), its group companies, its directors, associates, employees, nor any person connected with it accepts any liability or loss arising from the use of this document. The views and opinions expressed herein are based solely on the past performance of the schemes and/or securities and do not necessarily reflect the views of Fisdom. Past performance is no guarantee and does not indicate or guide future performance. The information set out herein may be subject to updating, completion, revision, verification, and amendment, and such information may change materially. Investing in securities markets involves risks, including the potential loss of principal amount in part or in full. The recommendations are based on the past performance of schemes and/or securities, which does not necessarily indicate future performance. The recommendations do not guarantee future results, and the value of the invested principal amount and investment returns may fluctuate over time. Therefore, it is essential to review your investment objectives, risk tolerance, and liquidity needs before making any investment decisions. While the information and data contained in this document have been obtained from sources believed to be reliable, Fisdom does not guarantee the accuracy, adequacy, completeness, timeliness, reliability, or availability of any information provided in this document. Fisdom is not responsible for any errors or omissions, regardless of the cause, or for the results obtained from the use of the information contained in this document. Fisdom accepts no liability for any losses or damages arising directly or indirectly (including special, incidental, or consequential losses or damages) from the use or reliance placed on any information or data contained in this document, including, without limitation, any lost profits, trading losses, or damage resulting from any errors, omissions, interruptions, deletions, or defects in any manner contained herein. Readers/Investors should be aware that this document may not be suitable for all types of investors. Investors should independently evaluate any investment or strategy discussed herein. Any decision(s) based on the information contained in this report shall be the sole responsibility of the Reader/Investor. Fisdom is a SEBI Registered Investment Advisor (RIA) [Registration No: INA200005323] and Research Entity [Registration No: INH000010238]. This document is prepared and distributed in accordance with the SEBI (Investment Advisers) Regulations, 2013, and other relevant regulations. Please read all relevant offer documents, risk disclosure documents, and terms and conditions related to the services provided by Fisdom before making any investment decision. For more details, please visit our official websites at www.fisdom.com


