
Sector Summary At Glance
| Index Name | Pattern Formation | Strategy | View |
| Realty | Triangle support with a bullish harami. | Bullish above 962, bearish below 800. | Neutral to bullish on confirmation. |
| Auto | Doji-like candle after three months of selling, signaling indecision. | Bullish above 22,950 | Oversold; potential reversal if confirmed. |
| Industrial | Rectangle pattern support with a bullish dragonfly Doji. | Bullish above 14,100 | Neutral to bullish on confirmation. |
| Capital Goods | Rectangle support with a bullish dragonfly Doji. | Bullish above 65,500 | Neutral to bullish on confirmation |
| Telecom | Inverse cup and handle near neckline, signaling potential breakdown. | Watch for a breakdown below the neckline for further downside | Bearish below 2,525, cautious until confirmation. |
| Bankex | Breakdown from rising channel | Bullish above 56,600 | Sideways; confirmation needed for breakout or breakdown. |
| Energy | Hammer candlestick at Fibonacci support, signaling potential
reversal. |
Bullish above 35,000 | Reversal likely if momentum sustains;
cautious below support. |
| Healthcare | Bullish hammer near 50 EMA (39,900), signaling potential rebound. | Bullish above 42,500 | Cautiously bullish if support holds; bearish below key levels. |
| Basic Material | Triangle breakdown, trading between 50 & 100 EMA with RSI bearish crossover. | Bullish above 7,200; bearish below 6,690. | Range-bound with a bearish bias unless key levels are breached. |
| FMCG | Breakdown from rising channel; bullish hidden divergence on RSI near 40. | Buy near 19,700 (100 EMA support); bullish breakout above 21,000 | Cautiously bullish if support holds |
| Consumer Durables | Breakdown from rising wedge; strong bearish momentum with RSI below 50. | Bullish above 59,000; bearish below 53,800. | Bearish bias unless key resistance is reclaimed. |
| IT | Higher high, higher low formation; bullish trend intact despite short-term consolidation. | Bullish momentum could push towards 46,000–48,000 | Positive bias |
Realty: Bullish if prices hold support with volume confirmation.
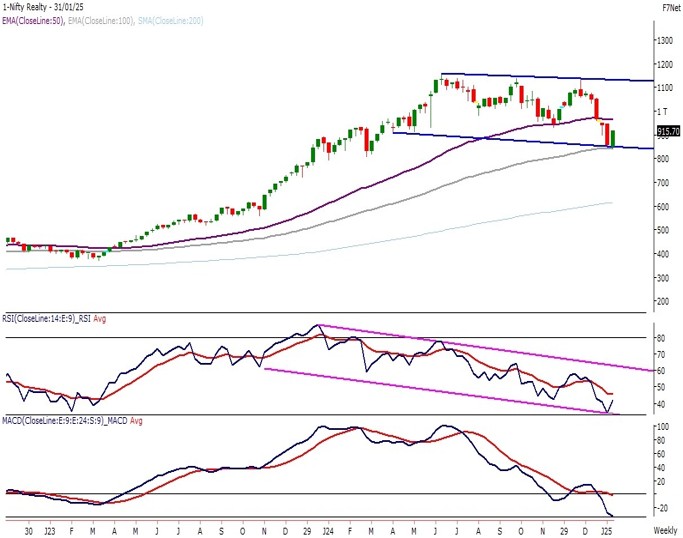
Trend Formation
NIFTY Realty Index hit triangle resistance earlier this month, dropping 14% and forming a tall bearish candle on the weekly chart.
Weekly Analysis
NIFTY Realty Index is finding support at the triangle’s lower band, forming a bullish harami on the weekly chart. A potential move depends on holding support with volume confirmation or bullish price action.
Momentum Indicators
The 100 EMA is acting as crucial support, suggesting a possible trend stabilization or reversal.
Key Levels
Support: 800
Resistance: 962
Bullish: If prices hold support and confirm with volume, a reversal could be in play.
Auto: The oversold indicator and the Doji formation hint at a reversal in the Auto Index.
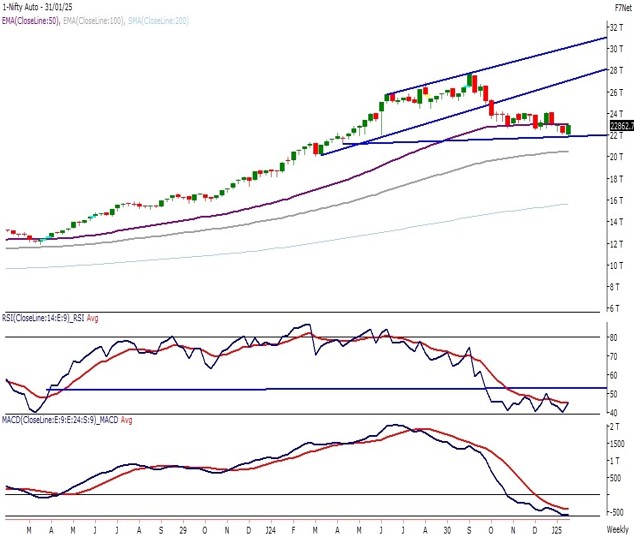
Trend Formation
After three months of selling, the NIFTY Auto Index formed a Doji-like candlestick on the monthly chart, signaling market indecision. The tight 22,000–22,600 range and a 0.5% decline reflect a lack of strong momentum, leaving the trend direction uncertain.
Weekly Analysis
The Doji pattern after a downtrend suggests a potential reversal if confirmed by bullish price action and volume. The index shows indecision, with sellers losing momentum but buyers yet to take control.
Momentum Indicators
The 100 EMA at 20,500 acts as key support, while oversold conditions hint at a possible bounce. A move above resistance could confirm a shift in trend.
Key Levels Support: 21,800
Resistance: 22,950 (Breakout could push prices toward 24,200)
The oversold indicator and the Doji formation hint at a reversal in the
Auto Index.