
Technical Overview – Nifty 50
NIFTY reached a new all-time high of 24,100 levels on June 28, 2024. This week, the benchmark index has risen steadily and seems unstoppable. The index closed at the upper band of the rising channel and is reversing from the same. A bearish candle has formed on the index.
The horizontal resistance breach was highlighted by the RSI (14) momentum indicator, which closed at the 69 level. The fact that the MACD is rising and above its polarity indicates that the positive trend should continue. The fact that the index is above each major DEMA adds extra support to the general bullishness.
For the upcoming sessions, the support and resistance levels are 24,200 and 24,400 and 23,800 and 23,650, respectively.
Technical Overview – Bank Nifty
The banking index had a pretty dull day and closed close to its bottom from yesterday. On a daily basis, the index has created an Evening Star candlestick pattern. Banking index is underperforming benchmark index.
The barrier at the downward-sloping trend line of the RSI (14) momentum indicator explains the lag in the upward momentum. The fact that the MACD is rising and above its polarity indicates that the positive trend should continue. Since the index is above each major DEMA, mean reversion movements could occur, but the overall bullish outlook is unaffected.
For the next sessions, the resistance and support levels are 53,250–53,500 for resistance and 52,600–52,350 for support.
Indian markets:
- On June 28, Indian equity indices extended their rally to new record highs, with the Nifty surpassing 24,100 and the Sensex reaching 79,600, driven by Reliance Industries and other major stocks.
- However, selling pressure at higher levels erased all the day’s gains, causing the indices to end in the red.
- After a gap-up opening at fresh record highs, the market stayed positive during the first half. However, in the second half, it fluctuated between gains and losses, ultimately closing near the day’s low.
- Sector-wise, healthcare, metal, PSU Bank, oil & gas, and realty indices rose by 0.5-1 percent, while the bank index fell by 1 percent and the capital goods index declined by 0.4 percent.
- The BSE midcap and smallcap indices each added 0.5 percent.
Global Markets:
- Asia-Pacific markets climbed on Friday, bolstered by positive economic data from Japan, which propelled the Topix stock index to a 34-year high. Investors were also focused on upcoming U.S. inflation data expected later in the day.
- Japan’s Nikkei 225 rebounded 0.64%, while the broad-based Topix rose 0.57% its highest level in 34 years.
- South Korea’s Kospi edged up 0.49%, and the small-cap Kosdaq closed 0.21% higher.
- Hong Kong’s Hang Seng index was up 0.36% in its final hour, while mainland China’s CSI 300 rebounded from a four-month low, gaining 0.22%.
- Australia’s S&P/ASX 200 rose 0.1%, paring earlier gains to end.
Stocks in Spotlight
- Shares of JSW Infrastructure surged over 5 percent, reaching a 52-week high of Rs 336, following the announcement of its plan to acquire a majority stake in Navkar Corporation.
- Polycab shares dropped over 5 percent following a significant block deal. The promoter group and family members of the electrical solutions provider planned to sell a 2.04 percent stake for up to $257 million (at the upper end of the price range) through the block deal.
- UltraTech Cement shares surged to a record high of Rs 11,875 per share as the market responded positively to its acquisition of a 23 percent stake in Chennai-based India Cements for Rs 1,889 crore.
News from the IPO world🌐
- Emcure Pharma announces price band for Rs 1,952-crore IPO at Rs 960-1,008/share
- Vraj Iron and Steel IPO subscribed nearly 40 times so far on last day.
- Insurer Niva Bupa plans $360 million IPO.
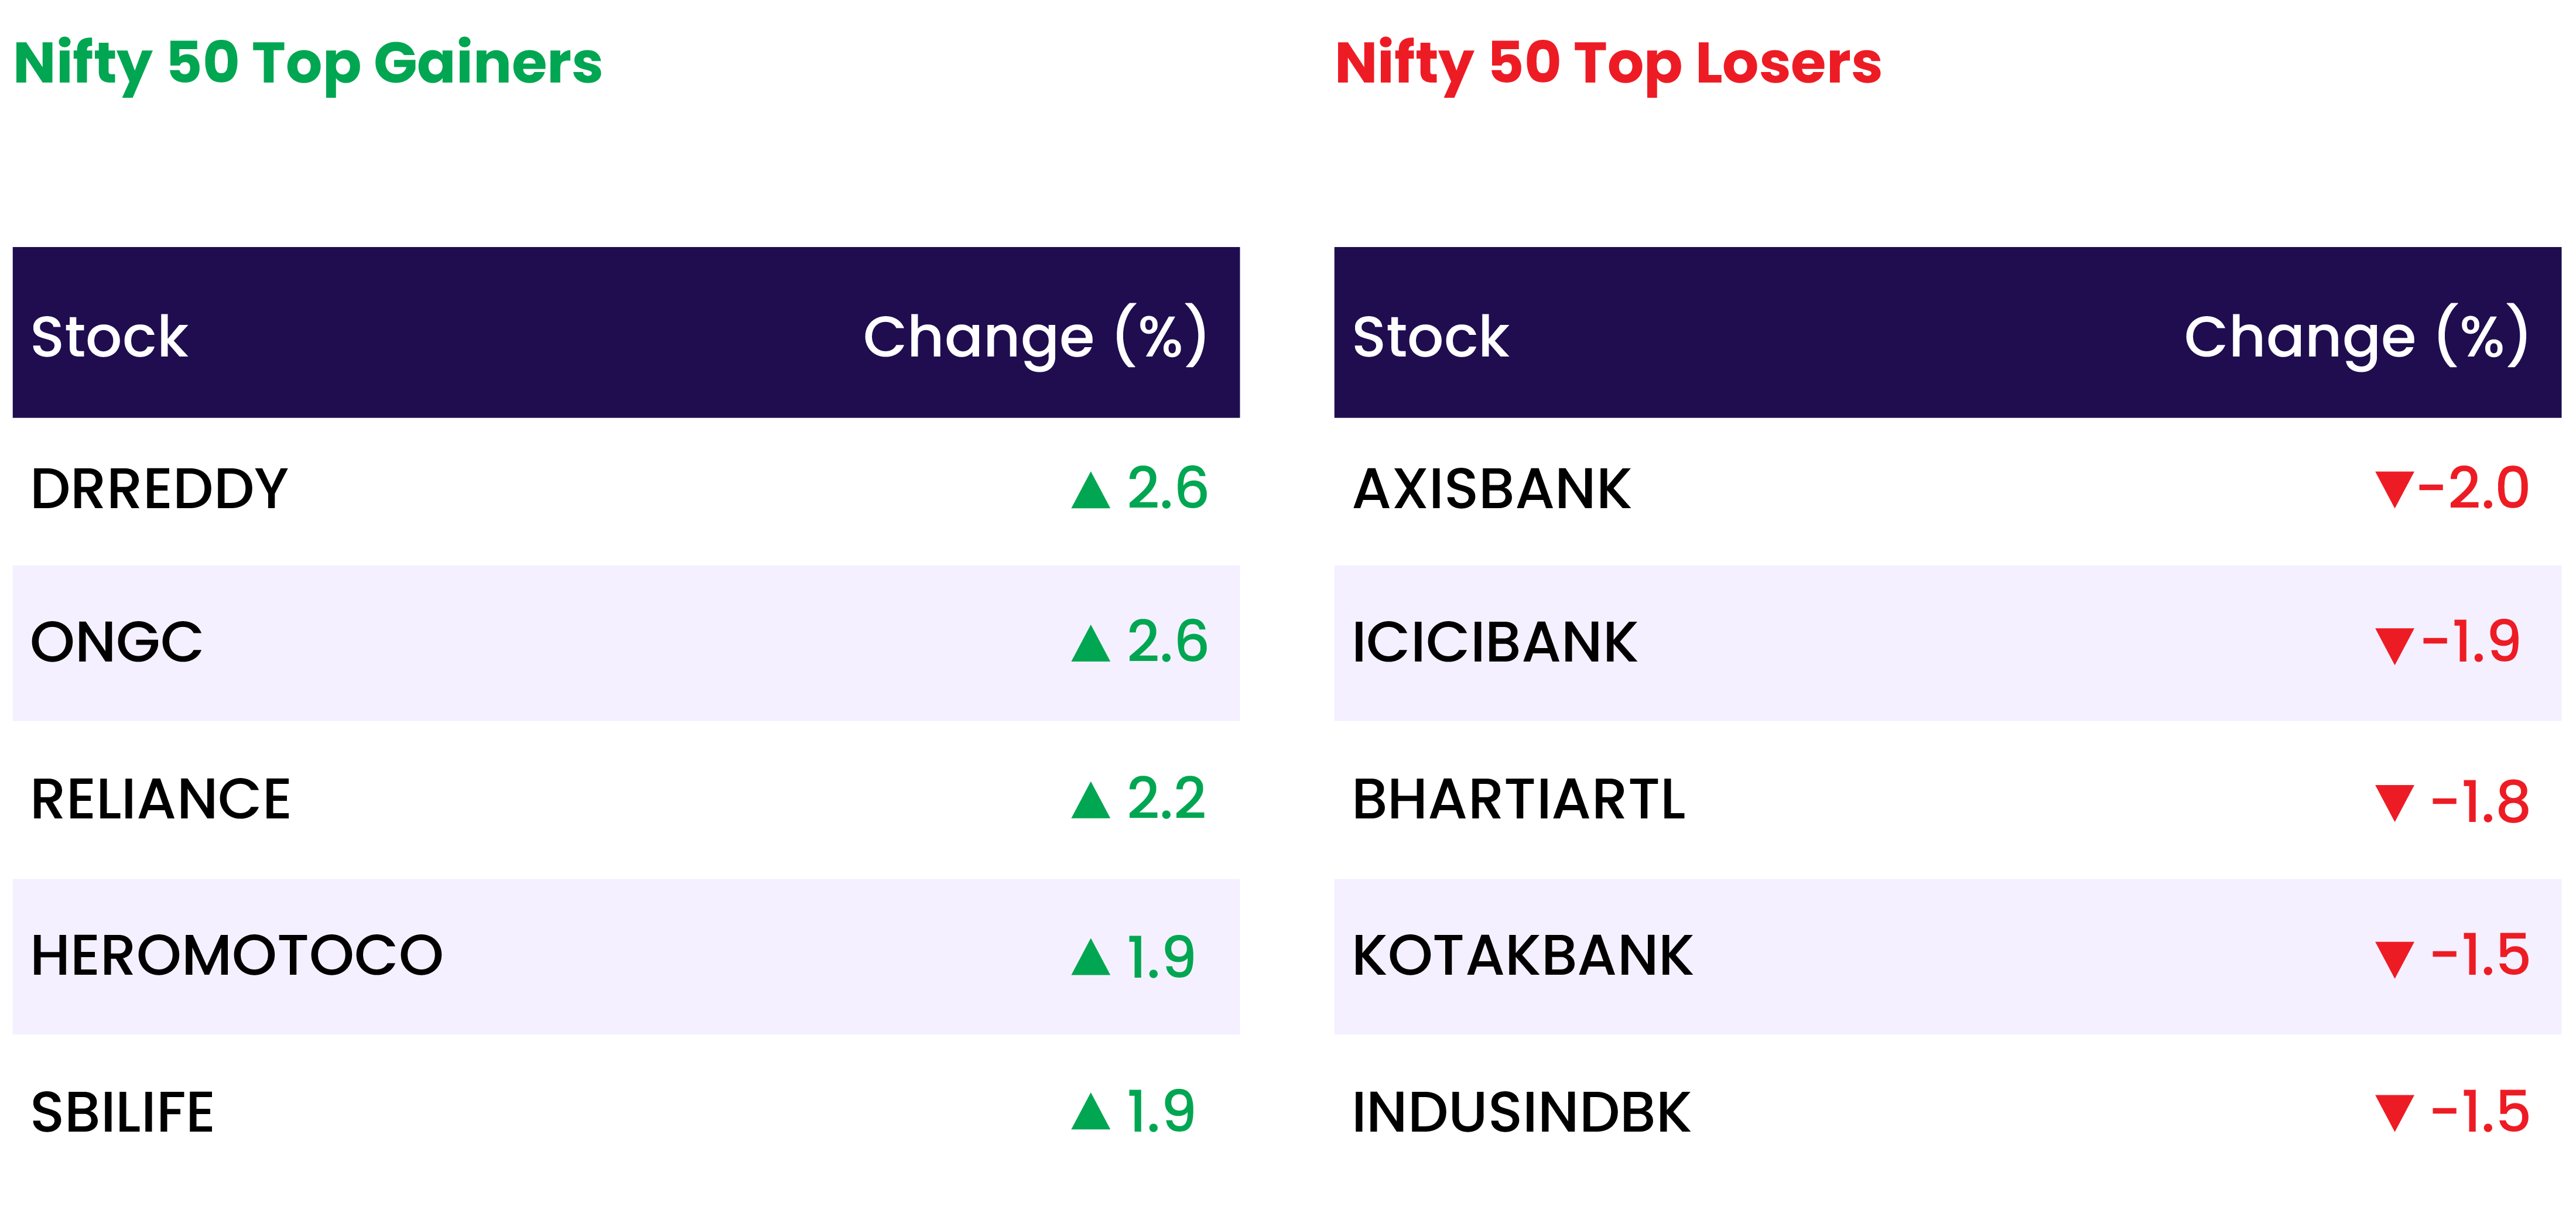
Daily Leader board:
Sectoral Performance
| Top Sectors | Day change (%) |
| NIFTY OIL & GAS | 1.7 |
| NIFTY PHARMA | 1.1 |
| NIFTY HEALTHCARE INDEX | 1.1 |
| NIFTY MIDSMALL HEALTHCARE | 1.1 |
| NIFTY PSU BANK | 0.9 |
Advance Decline Ratio
| Advance/Declines | Day change (%) |
| Advances | 2180 |
| Decline | 1725 |
| Unchanged | 107 |
Numbers to track
| Indices Name | Latest | % 1D | % YTD |
| Dow Jones (US) | 39,164 | 0.1 % | 3.8 % |
| 10 Year Gsec India | 7.0 | 0.1 % | 1.1 % |
| WTI Crude (USD/bbl) | 82 | 1.0 % | 16.1 % |
| Gold (INR/10g) | 71,430 | 0.2 % | 6.4 % |
| USD/INR | 83.54 | 0.1 % | 0.6 % |
Please visit www.fisdom.com for a standard disclaimer


