

Technical Overview – Nifty 50
The benchmark index had some significant upward momentum on July 25. The index ultimately closed above the zone of consolidation and hit new all-time highs. The previous session’s index reached strong support at the 10-DEMA, and bulls appear to be optimistic about the follow-through buying.
The momentum indicator for RSI (14) increased and closed close to 64 levels. The bullish trend is expected to continue as the MACD rises and above its polarity. A positive MACD crossover in the 75-minute timeframe further supports the resumption of the bullish momentum. The index’s position above each major DEMA lends more credence to the overall bullishness.
For the upcoming sessions, the levels of support and resistance are 23,550 and 23,350, and 23,900 and 24,000, respectively.
Technical Overview – Bank Nifty
The banking index had a great day, breaking prior highs and setting a new record high at the 52,700 mark. The index created a large bullish candle on a daily basis. The index has at last broken out of consolidation and has given a strong breakout.
The RSI (14) momentum indicator rose and closed at levels of 70. Given that the MACD is rising and above its polarity, the positive trend is anticipated to continue. The fact that the index is above each major DEMA adds extra support to the general bullishness.
The resistance and support levels for the upcoming sessions are 53,000–54,000 for resistance and 51,950–51,250 for support.
Indian markets:
- India’s benchmark indices, Sensex and Nifty, closed at fresh record highs on June 25, driven by gains in banking and IT stocks. This surge in the markets followed RBI data showing a current account surplus of $5.7 billion, or 0.6% of GDP, in the fourth quarter of the fiscal year 2023-24.
- Among sectoral indices, Nifty Bank and Nifty Private Bank each rose by 1.7%, while Nifty IT saw an increase of 0.8%. Conversely, Nifty Realty declined by 1.8%, and both Nifty Metal and Nifty Media fell by 0.7% and 0.5%, respectively.
Global Markets:
- On Tuesday, Mainland China’s CSI 300 closed at its lowest point since February 28, dropping 0.54%, marking a nearly four-month low. In contrast, most Asia-Pacific markets experienced gains. Hong Kong’s Hang Seng index remained flat during its final trading hour.
- Japan’s Nikkei 225 increased by 0.95%, while the broad-based Topix rose 1.72%, reaching its highest level in three weeks.
- South Korea’s Kospi climbed 0.35%, and the small-cap Kosdaq edged up, breaking a three-day losing streak.
- The Taiwan Weighted Index rebounded, advancing 0.27%. Australia’s S&P/ASX 200 also saw significant gains, closing 1.36% higher.
Stocks in Spotlight
- Amara Raja’s stock soared by 20 percent to reach an all-time high following the announcement of a technical licensing agreement with China-based Gotion High-Tech.
- Olectra Greentech shares rose by 9 percent as brokerages anticipate further potential for the stock. Geojit Financial Services highlighted several positives for the company, including a strong order book, capacity expansion, and the scalability of multiple powertrains. As a result, they upgraded their target price for the stock from ‘Accumulate’ to ‘Buy’.
- Shriram Finance rose by 4 percent to hit a 52-week high of ₹2,999. In an interaction with CNBC-TV18, YS Chakravarti, the MD and CEO of the company, indicated that Shriram Finance might increase its asset under management (AUM) growth guidance after the first half of fiscal year 2025. He also expects strong growth numbers in Q3 and Q4 of FY25.
News from the IPO world🌐
- Allied Blenders IPO to open on Tuesday
- Vraj Iron and Steel IPO price band fixed at Rs 195-207/share. Issue to open on June 26
- Insurer Niva Bupa plans $360 million IPO
Daily Leader board:
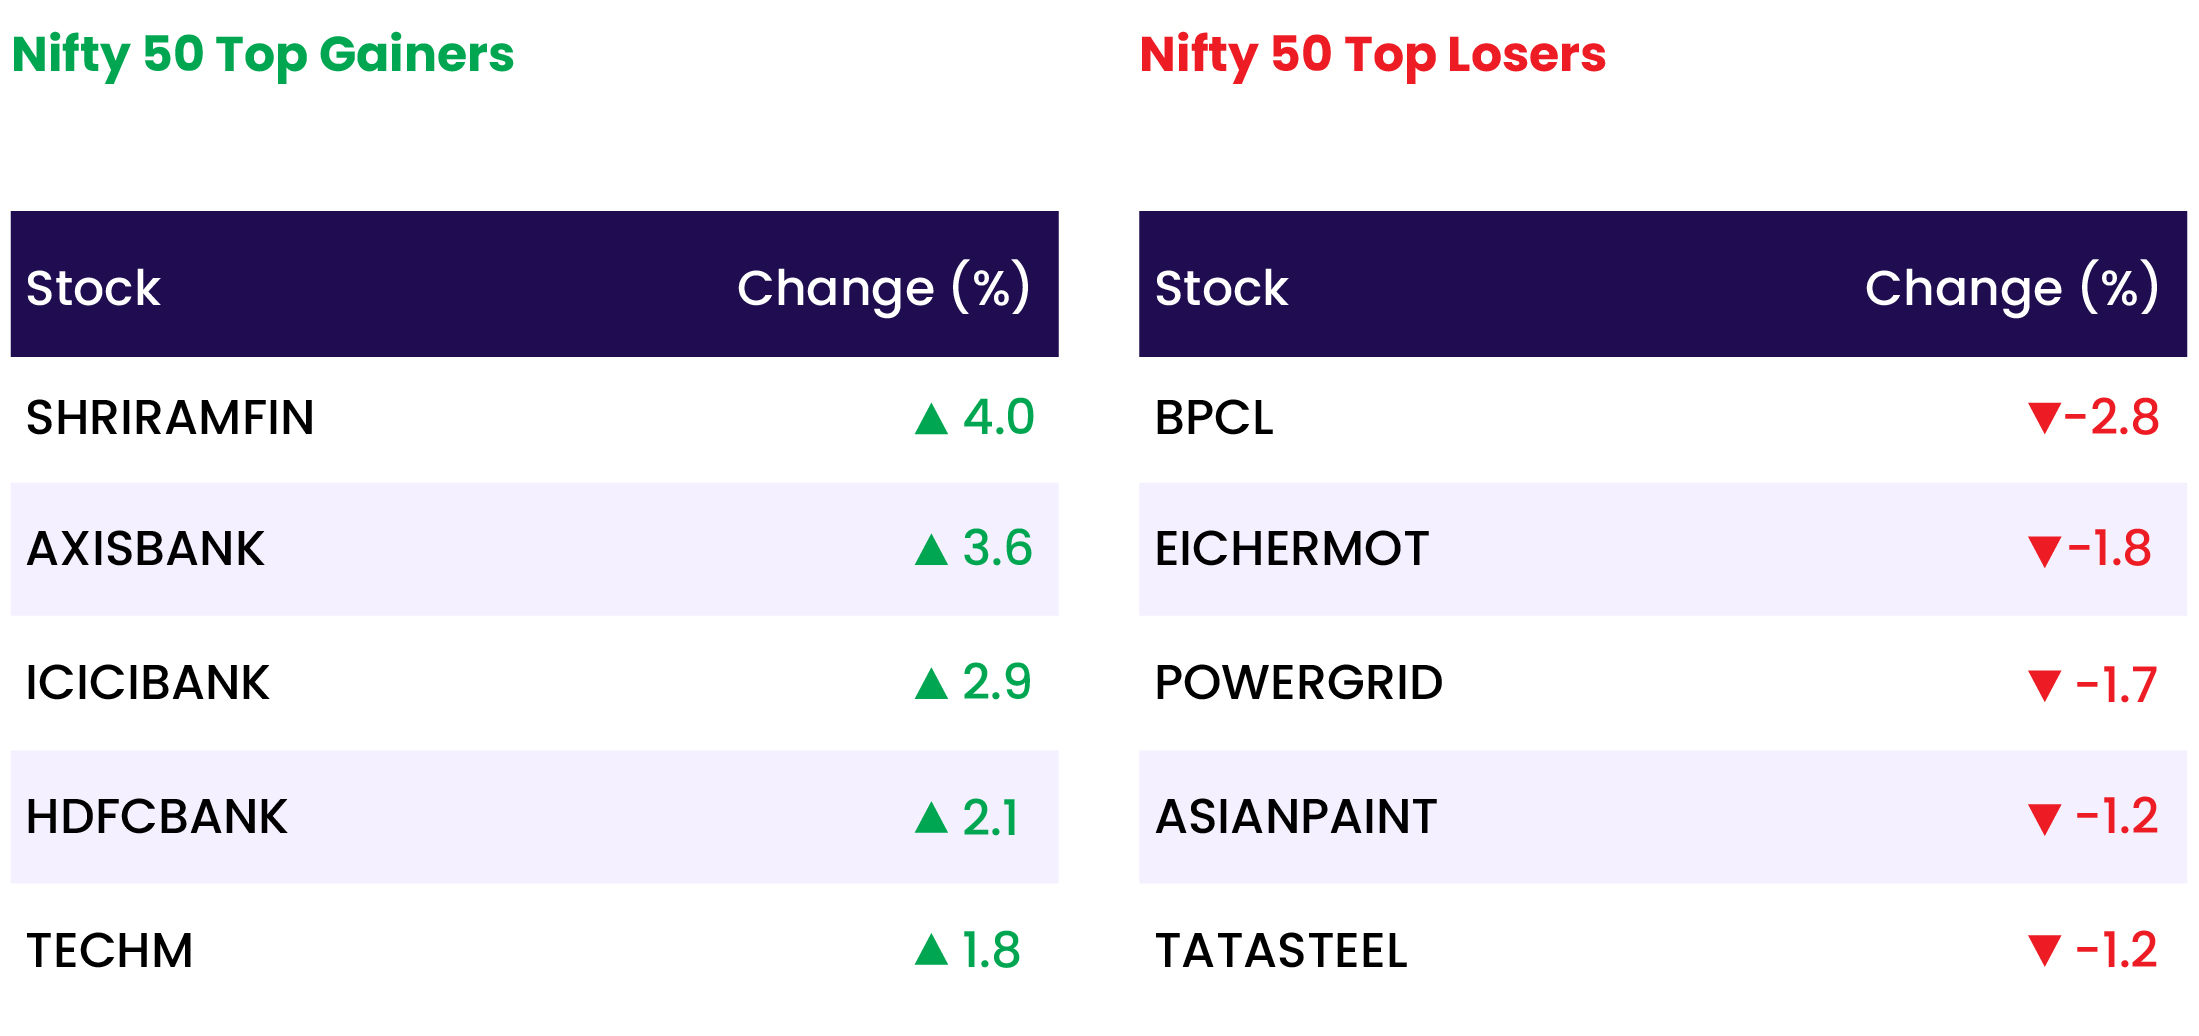
Sectoral Performance
| Top Sectors | Day change (%) |
| NIFTY FINANCIAL SERVICES | 1.9 |
| NIFTY BANK | 1.7 |
| NIFTY PRIVATE BANK | 1.7 |
| NIFTY IT | 0.8 |
| NIFTY PSU BANK | 0.1 |
Advance Decline Ratio
| Advance/Declines | Day change (%) |
| Advances | 2107 |
| Decline | 1890 |
| Unchanged | 159 |
Numbers to track
| Indices Name | Latest | % 1D | % YTD |
| Dow Jones (US) | 39,411 | 0.7 % | 4.5 % |
| 10 Year Gsec India | 7.0 | 0.2 % | 0.7 % |
| WTI Crude (USD/bbl) | 82 | 1.1 % | 16.0 % |
| Gold (INR/10g) | 71,507 | (0.0) % | 6.3 % |
| USD/INR | 83.57 | (0.0) % | 0.6 % |
Please visit www.fisdom.com for a standard disclaimerFriday, March 1st


