

Technical Overview – Nifty 50
The Benchmark index had an extremely dull session with barely any momentum on either side. The index has entered a consolidation phase in proximity to its peak levels.
The index has formed a hanging man candlestick, close to the previous high of the index. Momentum indicators are having difficulty surpassing their prior peaks, suggesting a lag in the upward momentum. The MACD is rising above its polarity, suggesting that an upside continuation is possible.
On a 15-minute timeframe, the index is forming a higher-low pattern. Additionally, the momentum indicator, the RSI (14), corroborates the price movement with a higher-low pattern.
For the next sessions, 23,400 and 23,200 are the support levels while 23,700 and 23,850 are the resistance levels.
Technical Overview – Bank Nifty
Following a very positive day, follow-up buying is taking place in the banking index. The index closed above the upward wedge pattern. The index closed close to the day’s peak after forming a hammer candlestick pattern.
The upward trend on the index is confirmed by the momentum indicator, RSI (14) heading higher. The MACD is confirming the general index rise by remaining above its polarity and reaching a higher high.
Since the index is above the important short-term DEMAs of 10, 20, and 50, the general bullish trend is confirmed.
For the next sessions, resistance will be between 52,000 and 52,500, while support will be between 51,000 and 50,600.
Indian markets:
- The domestic benchmark equity indices, Sensex and Nifty 50, closed Thursday’s session in the green after facing some volatility during the trade.
- Metal, real estate, and bank stocks drove the gains despite weak global signals. Selling pressure was observed in auto, pharma, and PSU bank stocks, while buying interest was strong in the metal, capital goods, real estate, and oil & gas sectors.
- In the broader market, the Nifty Midcap 100 rose by 0.95%, and the Nifty SmallCap 100 increased by 0.61%, both outperforming the benchmark indices. The fear gauge index, India VIX, decreased by 2.68% on Thursday.
Global Markets:
- Asia-Pacific markets mostly declined on Thursday as China maintained its one- and five-year loan prime rates.
- Mainland China’s CSI 300 dipped 0.72%, while Hong Kong’s Hang Seng index fell 0.65% by the final hour of trading. In South Korea, the Kospi added 0.37%,
- While the small-cap Kosdaq dropped 0.43%. Shares of HMM, South Korea’s largest container shipping company, surged over 3%.
- Japan’s Nikkei 225 rose 0.16%, while the broad-based Topix slipped 0.11%.
- The Taiwan Weighted Index climbed 0.85% to finish at 23,406.10, marking new highs for the third consecutive day.
- Australia’s S&P/ASX 200 remained flat. Shares of the Mexican-themed fast-food chain Guzman y Gomez soared up to 39% in its Australian market debut on Thursday, closing 36% higher on the first day of trading.
Stocks in Spotlight
- Shares of New India Assurance Company surged 6 percent after the PSU insurer announced the appointment of Girija Subramanian as Chairperson and Managing Director (MD) of the company.
- Muthoot Microfinance shares jumped over 3.75 percent on June 20 after UK-based brokerage firm Investec issued a ‘buy’ rating, citing a strong growth outlook and setting a target price of Rs 350 per share.
- Fertilizer stocks surged up to 20 percent, extending gains from the previous session, following reports of a proposal to remove Goods and Services Tax (GST) on fertilizers. Shares of companies including state-run National Fertilizers (NFL), Deepak Fertilizers, Madras Fertilizers, Chambal Fertilizers, and RCF saw significant increases.
News from the IPO world🌐
- Stanley Lifestyles IPO opens on June 21
- Vraj Iron and Steel IPO price band fixed at Rs 195-207/share. Issue to open on June 26
- Ola Electric, Emcure Pharma get Sebi nod for IPOs, setting stage for big listings
Daily Leader board:
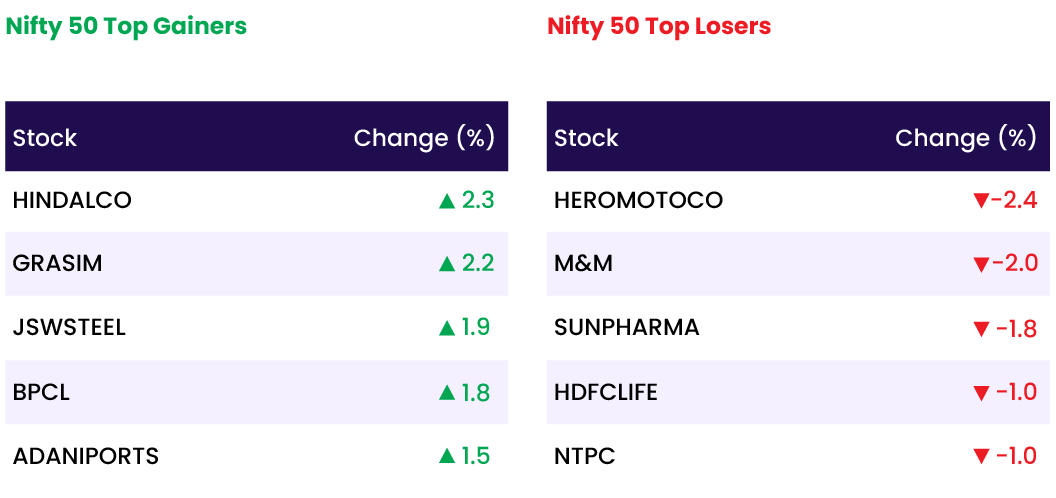
Sectoral Performance
| Top Sectors | Day change (%) |
| NIFTY REALTY | 2.0 |
| NIFTY METAL | 1.8 |
| NIFTY PRIVATE BANK | 1.2 |
| NIFTY OIL & GAS | 0.9 |
| NIFTY BANK | 0.8 |
Advance Decline Ratio
| Advance/Declines | Day change (%) |
| Advances | 2282 |
| Decline | 1571 |
| Unchanged | 128 |
Numbers to track
| Indices Name | Latest | % 1D | % YTD |
| Dow Jones (US) | 38,835 | 0.2 % | 3.0 % |
| 10 Year Gsec India | 7.0 | 0.1 % | 0.5 % |
| WTI Crude (USD/bbl) | 82 | 4.0 % | 15.9 % |
| Gold (INR/10g) | 71,901 | 0.5 % | 5.2 % |
| USD/INR | 83.42 | (0.1) % | 0.5 % |
Please visit www.fisdom.com for a standard disclaimer


