
Technical Overview – Nifty 50

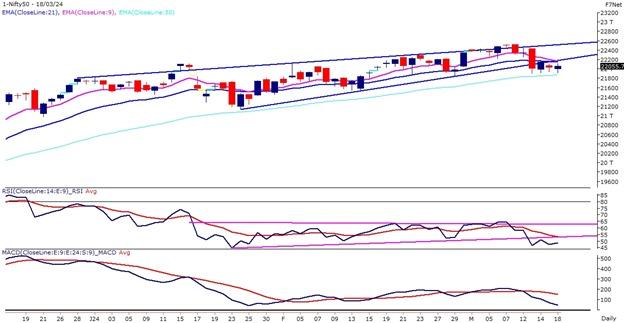
The Volatility was the hallmark in the past week’s trading sessions where the Index dropped more than 1.50 percent and formed a bearish candle on the weekly chart. The prices witnessed a breakdown of an ending diagonal pattern on the daily chart and closed below the same.
The Index started its week with uncertainty where prices swung both ways initially and led traders to keep guessing the trend. Later on, the prices witnessed a breakout on the intraday chart above its trend line resistance and kept bulls alive for the day.
Volatility also is likely to be the hallmark as investors now shift their attention to the upcoming Lok Sabha polls. The Index on the daily chart is trading between 21 & 50 EMA and the breakout on either side initiates a trigger on either side.
Technically speaking, from inter monthly perspective, all bullish eyes are still on the Nifty at the 21,800 mark. For the week, Nifty’s hurdles are at the 22,300 mark on a closing basis. That said, the downside risk, or rather the major support still seen at the Nifty 21,800 mark.
Technical Overview – Bank Nifty

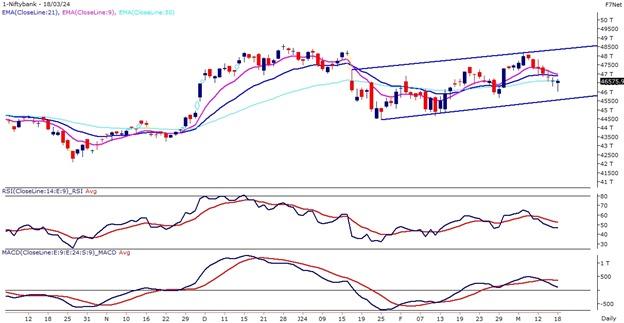
It was carnage selling in the Banking Index in the past week and the volatility was the only factor where traders were on the firing line for the entire week. The Bank Nifty on the weekly chart has formed a tall bearish candle and the index has witnessed a correction of more than 2.50 percent for the week.
The Index started its week with uncertainty where prices swung both ways initially and led traders to keep guessing the trend. Later on, the prices witnessed a breakout on the intraday chart above its inverted head and shoulder pattern and kept bulls alive for the day after witnessing a V-shaped recovery on the intraday chart.
The Banking Index has drifted below its 9, 21, and 50 EMA on the daily chart, and the RSI (14) is reading below 50 levels with a bearish crossover on the cards. The market context has changed for now as sellers use every smaller rally as a selling opportunity. The immediate support for the Bank Nifty is placed at 46,000 levels and 47,300 will act as an immediate resistance for the Banking index.
Indian markets:
- Domestic equity benchmarks Nifty 50 and Sensex closed with mild gains on Monday, March 18, with modest gains, fueled primarily by notable performances from leading players in the metal and auto sectors.
- March 18 marked a positive closure for the benchmark indices, with Nifty hovering around 22,050, as it also managed to offset a portion of losses incurred in the preceding session, courtesy of widespread buying across various sectors, excluding IT and FMCG.
- After a negative start, the market remained in a range throughout the first half, while some selling was seen in the mid-session. However, the market erased all the losses in the second half to close with moderate gains.
- Among sectors, capital goods, healthcare, auto, realty, metal and media were up 0.5-3 percent, while IT and FMCG shed 0.5-1.5 percent.
Global Markets:
- The Nikkei 225 index led the way in Asia-Pacific markets on Monday, with Japan’s market closing notably higher, while Chinese shares continued to surge following strong economic data.
- Japan’s Nikkei 225 concluded the day 2.67% up at 39,740.44, with the Topix also posting gains, rising by 1.92% to close at 2,721.99.
- Over in Europe, the Bank of England is anticipated to maintain its rates at 5.25%.
- China’s CSI 300 index finished the day 0.94% higher at 3,603.53, marking its sixth consecutive session in positive territory.
- Meanwhile, Hong Kong’s Hang Seng index, despite starting nearly 0.3% lower, was trading approximately 0.2% higher in the final hour of trading.
Stocks in Spotlight
- Oil India witnessed a significant surge of 12.4 percent driven by a bullish production outlook. According to brokerage house Motilal Oswal, Oil India’s production growth guidance remains strong, bolstered by increased drilling activity and development wells in existing areas. This positive assessment contributed to the notable uptick in Oil India’s stock price.Top of Form
- Tata Steel Ltd’s shares soared by over 5%, supported by heavy trading volumes and numerous substantial transactions. The positive outlook was bolstered by robust industrial output growth in China. Trading activity saw nearly 10 crore shares of Tata Steel changing hands on March 18, more than twice the average volume of the previous month.
- Torrent Power Ltd witnessed a 3% surge in its stock price following the company’s successful bid for a letter of award to establish 300 MW wind solar hybrid projects valued at Rs 3,650 crore. These projects are slated to be operational within 24 months from the signing of the power purchase agreement (PPA).
- KPI Green Energy Ltd experienced a 5% surge in its share price after securing the winning bid for the Maharashtra State Power Generation tender to develop a 100MWAC solar power project. KPI Green’s involvement extends to the engineering, procurement, and construction (EPC) package, including land provision, for the development of a 600 MW solar project across various locations in Maharashtra.
News from the IPO world🌐
- Shares worth $21 billion to enter market in 4 months as IPO lock-in period expires for 66 companies
- Krystal Integrated Services IPO fully booked on Day 3
- Transrail Lighting files IPO papers with Sebi; eyes Rs 450-cr via fresh issue
Daily Leader board:

Sectoral Performance
| Top Sectors | Day change (%) |
| NIFTY METAL | 2.5 |
| NIFTY AUTO | 1.3 |
| NIFTY MEDIA | 1.2 |
| NIFTY HEALTHCARE INDEX | 0.7 |
| NIFTY PHARMA | 0.5 |
Advance Decline Ratio
| Advance/Declines | Day change (%) |
| Advances | 2008 |
| Decline | 1932 |
| Unchanged | 116 |
Numbers to track
| Indices Name | Latest | % 1D | % YTD |
| Dow Jones (US) | 38,715 | (0.5) % | 2.7 % |
| 10 Year Gsec India | 7.1 | 0.4 % | (1.2) % |
| WTI Crude (USD/bbl) | 81 | 1.9 % | 15.5 % |
| Gold (INR/10g) | 65,446 | 0.1 % | 1.4 % |
| USD/INR | 82.89 | 0.1 % | (0.2) % |
Please visit www.fisdom.com for a standard disclaimer


