

Technical Overview – Nifty 50
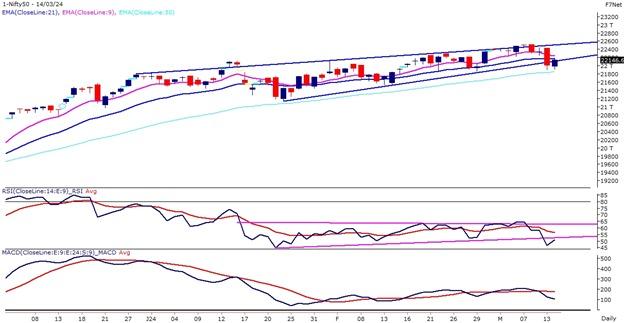
After a brutal sell-off, the Nifty50 witnessed a marginal gap down opening and registered its intraday low within the first 15 minutes of the trade. Post forming a low the Index traded higher throughout the day but traded below its 9 and 21 EMA.
The Benchmark index on the daily chart has witnessed a rising wedge pattern breakdown and prices traded near the lower band of the wedge pattern. The momentum oscillator RSI (14) has given a consolidation breakdown below 50 levels with a bearish crossover. The MACD indicator has witnessed a bearish crossover above its line of polarity signals early signs of trend deterioration.
The Nifty50 on the weekly chart is forming a bearish engulfing candle stick pattern and if prices close below 22,200 levels then the bearish pattern will be confirmed. The Advance decline ratio was in the favor of the bulls after four trading sessions.
The immediate support for the Nifty50 is placed at 21,800 levels near its 50 EMA and 22,300 will act as an immediate resistance for the index.
Technical Overview – Bank Nifty
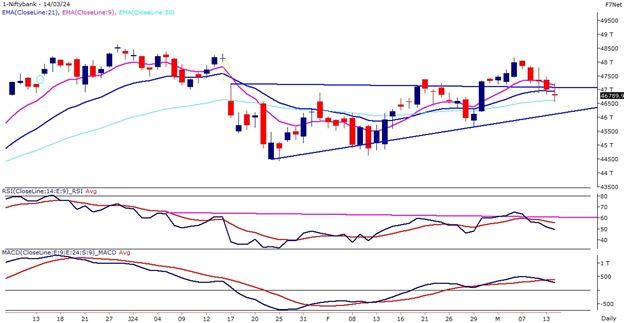
The Bank Nifty continued to trade lower for the fifth straight day and prices have drifted near 46,900 levels and formed a bearish candle on the daily time frame. The Bank Nifty on the weekly chart has already drifted below 2 percent.
The Index has drifted below its 9 EMA and it is hovering near its 21 EMA on the daily time frame. The momentum oscillator RSI (14) has formed a rounding top near 65 levels and drifted lower near 50 levels with a bearish crossover on the cards.
The market context has changed for now as sellers use every smaller rally as a selling opportunity. The immediate support for the Bank Nifty is placed at 46,500 levels near its 50 EMA and 47,500 will act as an immediate resistance for the Banking index.
Indian markets:
- The Indian stock market experienced broad-based buying on Thursday, March 14, facilitating commendable gains for the equity benchmarks – the Sensex and the Nifty 50.
- Despite mixed global signals, the Indian stock market continued its upward trajectory. Analysts suggest that institutional investors strategically amassed high-quality stocks post a recent correction, indicating their confidence in the resilience of the domestic market.
- The anticipation of robust economic expansion further enhances the attractiveness of the Indian stock market as an investment destination.
- Except for bank, all other sectoral indices ended in the green with telecom, power, oil & gas added 3 percent each, while auto, capital goods, FMCG, Information Technology, healthcare and metal rose 1-2 percent.
Global Markets:
- Asia-Pacific markets displayed a mixed performance on Thursday following the dissipation of Wall Street’s tech-driven rally. Investor attention was drawn to Japan’s ongoing spring wage negotiations and India’s wholesale inflation figures.
- Japan’s Nikkei 225 managed to turn around earlier losses, posting a 0.29% increase, while the broader Topix index saw a more substantial gain of 0.30%. Defensive utility stocks led the upward movement as investors maintained a cautious stance.
- South Korea’s Kospi index surged by 0.94%, contrasting with a slight slip of 0.27% in the Kosdaq index, breaking a four-day winning streak.
- Hong Kong’s Hang Seng index experienced a decline of 0.83% after an initial climb, while mainland China’s CSI 300 closed down by 0.28%.
- In Australia, the S&P/ASX 200 ended the day with a 0.2% decrease, despite mining stocks rallying on the continued strength of gold.
- European markets edged higher at the Thursday open, with investors keeping an eye out for another key U.S. inflation reading for February.
Stocks in Spotlight
- Oil India witnessed a significant surge of 12.4 percent driven by a bullish production outlook. According to brokerage house Motilal Oswal, Oil India’s production growth guidance remains strong, bolstered by increased drilling activity and development wells in existing areas. This positive assessment contributed to the notable uptick in Oil India’s stock price.Top of Form
- Spicejet saw a significant surge of 7.4 percent during early trading, as it finalized lease agreements for 10 aircraft aimed at bolstering capacity for the upcoming summer schedule. This strategic move is geared towards meeting the heightened demand from passengers during peak seasons, underlining the airline’s commitment to seamless connectivity and addressing increased travel needs.
- Shares of SJVN witnessed an impressive jump of approximately 18 percent after SJVN Green Energy Limited secured a Letter of Intent (LOI) from Gujarat Urja Vikas Nigam Limited (GUVNL) for a 500 MW solar project. Valued at Rs 2,700 crore, this project will be developed at GIPCL Solar Park in Khavda. SGEL had previously secured the project through tariff-based competitive bidding and will operate it on a build-own-operate basis.
- Adani Green Energy experienced a notable surge of nearly 10 percent, following an agreement by its subsidiary with Solar Energy Corporation of India (SECI) for 534-MW projects. Adani Renewable Energy Fifty Nine Limited entered into power purchase agreements (PPAs) with SECI for the supply of solar power.
News from the IPO world 🌐
- Shares worth $21 billion to enter market in 4 months as IPO lock-in period expires for 66 companies
- Vishal Mega Mart planning $1 billion IPO
- Transrail Lighting files IPO papers with Sebi; eyes Rs 450-cr via fresh issue
Daily Leader board:
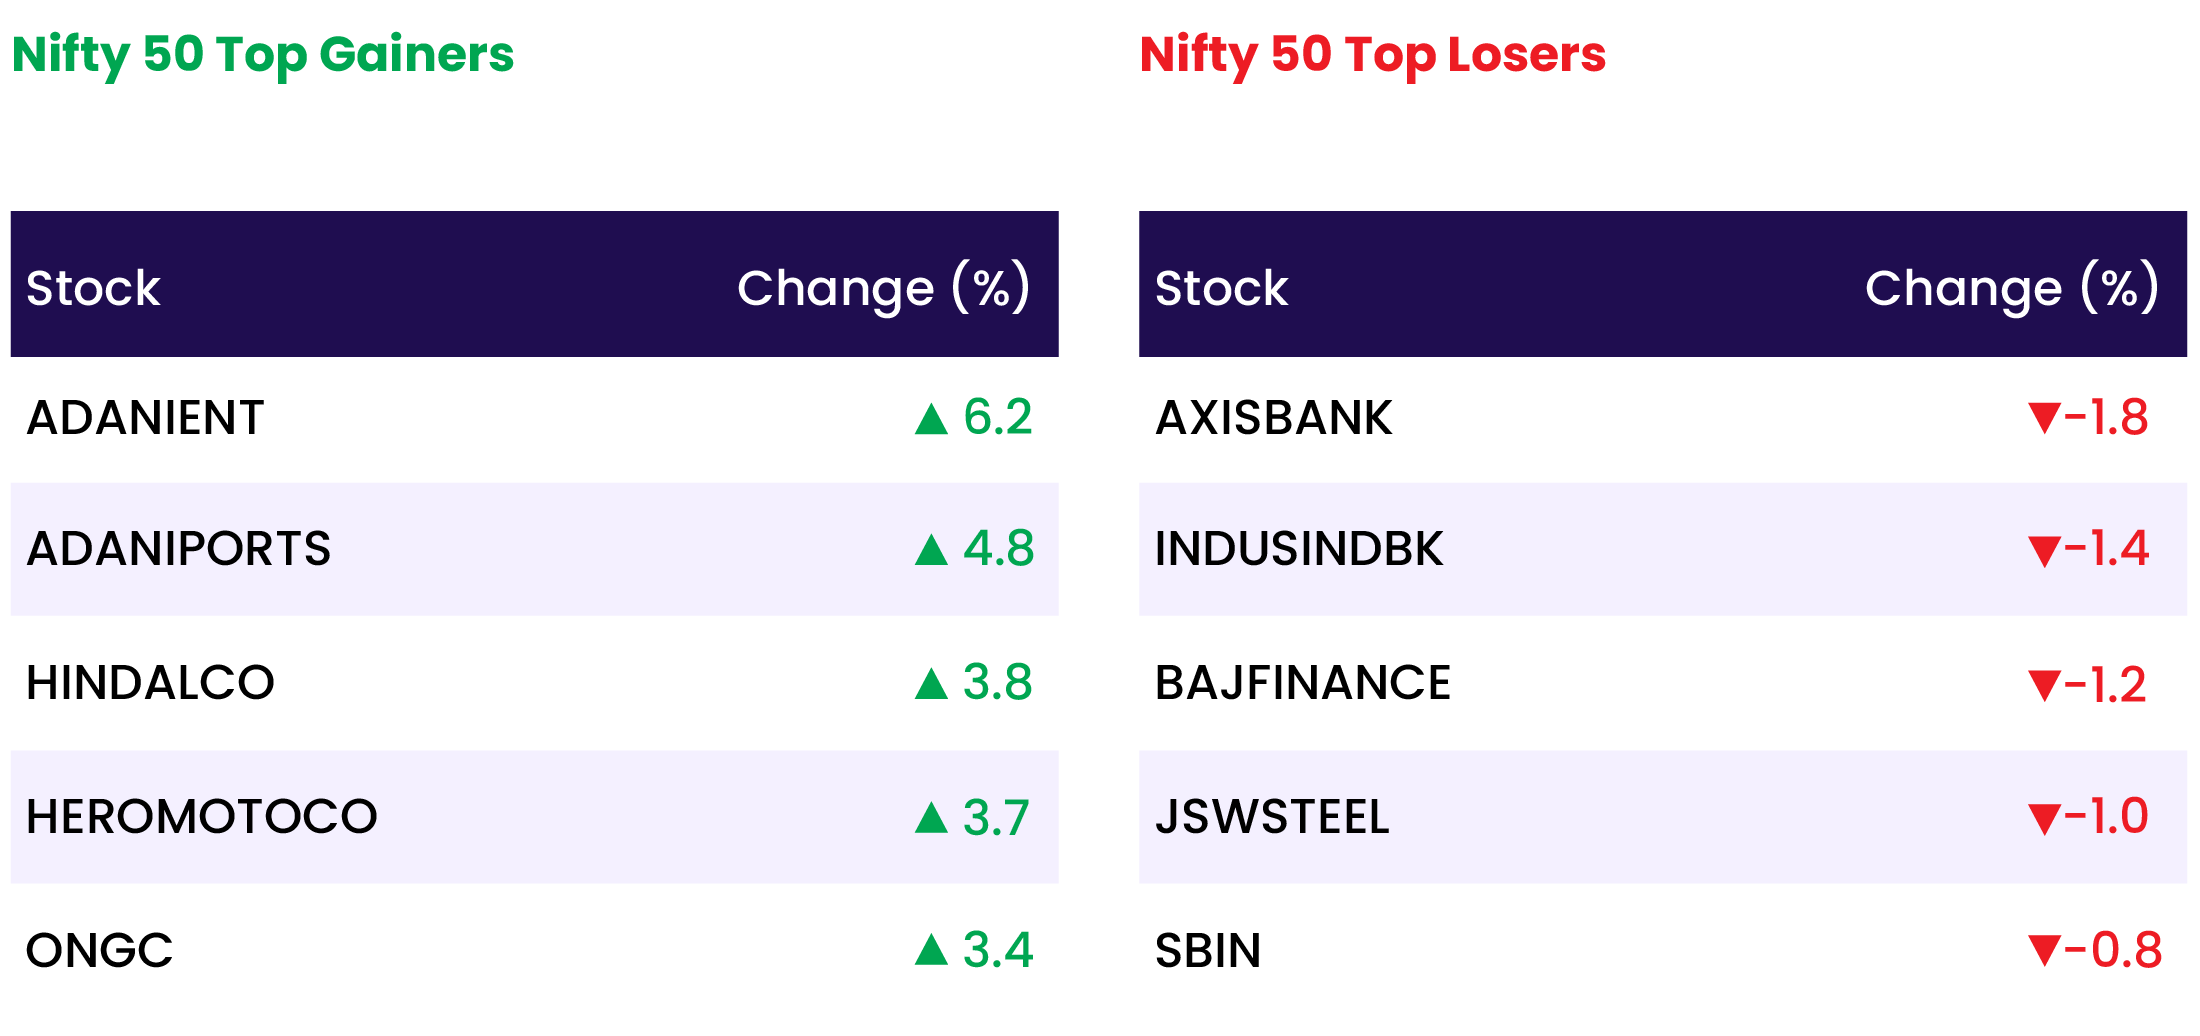
Sectoral Performance
| Top Sectors | Day change (%) |
| NIFTY OIL & GAS | 2.3 |
| NIFTY METAL | 2.0 |
| NIFTY IT | 2.0 |
| NIFTY MEDIA | 2.0 |
| NIFTY PHARMA | 1.4 |
Advance Decline Ratio
| Advance/Declines | Day change (%) |
| Advances | 2722 |
| Decline | 1153 |
| Unchanged | 83 |
Numbers to track
| Indices Name | Latest | % 1D | % YTD |
| Dow Jones (US) | 39,043 | 0.1 % | 3.5 % |
| 10 Year Gsec India | 7.0 | 0.1 % | (1.6) % |
| WTI Crude (USD/bbl) | 80 | 2.8 % | 13.3 % |
| Gold (INR/10g) | 65,633 | (0.1) % | 1.7 % |
| USD/INR | 82.84 | 0.1 % | (0.3) % |
Please visit www.fisdom.com for a standard disclaimer

