
Technical Overview – Nifty 50

It was again a narrow-range trading session for the Benchmark Index where prices continued to hover between 100 points range. On the daily chart, the Nifty has again formed a Doji candle stick pattern with long tail indicating a reversal from the lower levels.
On the weekly chart, the Index has given a bullish breakout of a consolidation pattern and prices are trading above the upper band of the range. The Index on the daily chart is trading near the upper band of the rising wedge pattern.
It’s a buy-on-dips market presently and any dip towards 22,200 which be utilized as a fresh buying opportunity. The immediate resistance is likely to be capped near 22,500 levels.
Technical Overview – Bank Nifty

The Banking Index continues to outperform the Benchmark Index and trade above 47,200 levels on the daily time frame. Post-second-half prices suddenly spiked on the higher side and moved above 47,500 levels.
The Bank Nifty on the daily chart has given a cup and handle pattern breakout and the index is trading above the upper band of range. The Banking Index is trading above its 9, 21, and 50 EMA, and the slope of the average is moved higher indicating a bullish stance. The prices on the weekly chart are trading in a rising wedge pattern and prices have reversed from the lower levels of the pattern.
It’s a buy-on-dips on Bank Nifty presently and any dip towards 47,200 which be utilized as a fresh buying opportunity. The immediate resistance is likely to be capped near 48,200 levels.
Indian markets:
- Domestic equity market benchmarks the Nifty 50 and the Sensex broke their four-day winning streak, influenced by subdued global signals.
- A significant portion of stocks within these pivotal indices experienced selling pressure as investors divested from equities, citing inflated valuations. Most anticipated positives seemed to have already been factored in, while new catalysts remained elusive.
- Mixed trend was seen on the sectoral front, with auto index up 1.3 percent, PSU Bank index up 2.5 percent and oil & gas, power and realty up 0.5 percent each, while IT and FMCG indices shed 1 percent each.
Global Markets:
- Asia-Pacific markets are mixed as China’s “Two Sessions” meeting got under way, with investors watching out for the details of its economic plans after the country projected a gross domestic product growth target of “around 5%” for 2024.
- Hong Kong’s Hang Seng index led losses in Asia, down 2.65%, while the mainland China’s CSI 300 index ended 0.7% higher at 3,565.51, highest since late November.
- South Korea’s Kospi slipped 0.93% at 2,649.40, and the small-cap Kosdaq shed 0.76% at 866.37.
- Japan’s Nikkei 225 fell marginally, although it still remained above the 40,000 mark and closed at 40,097.63. The broad based Topix also gained 0.5% to 2,719.93, hitting a new all-time high.
- European stocks were lower Tuesday as markets struggle to find positive momentum ahead of the European Central Bank meeting later this week.
- U.S. stock futures ticked lower Monday night after the Nasdaq Composite retreated from its record high.
Stocks in Spotlight
- Oil India witnessed a significant surge of 12.4 percent driven by a bullish production outlook. According to brokerage house Motilal Oswal, Oil India’s production growth guidance remains strong, bolstered by increased drilling activity and development wells in existing areas. This positive assessment contributed to the notable uptick in Oil India’s stock price.Top of Form
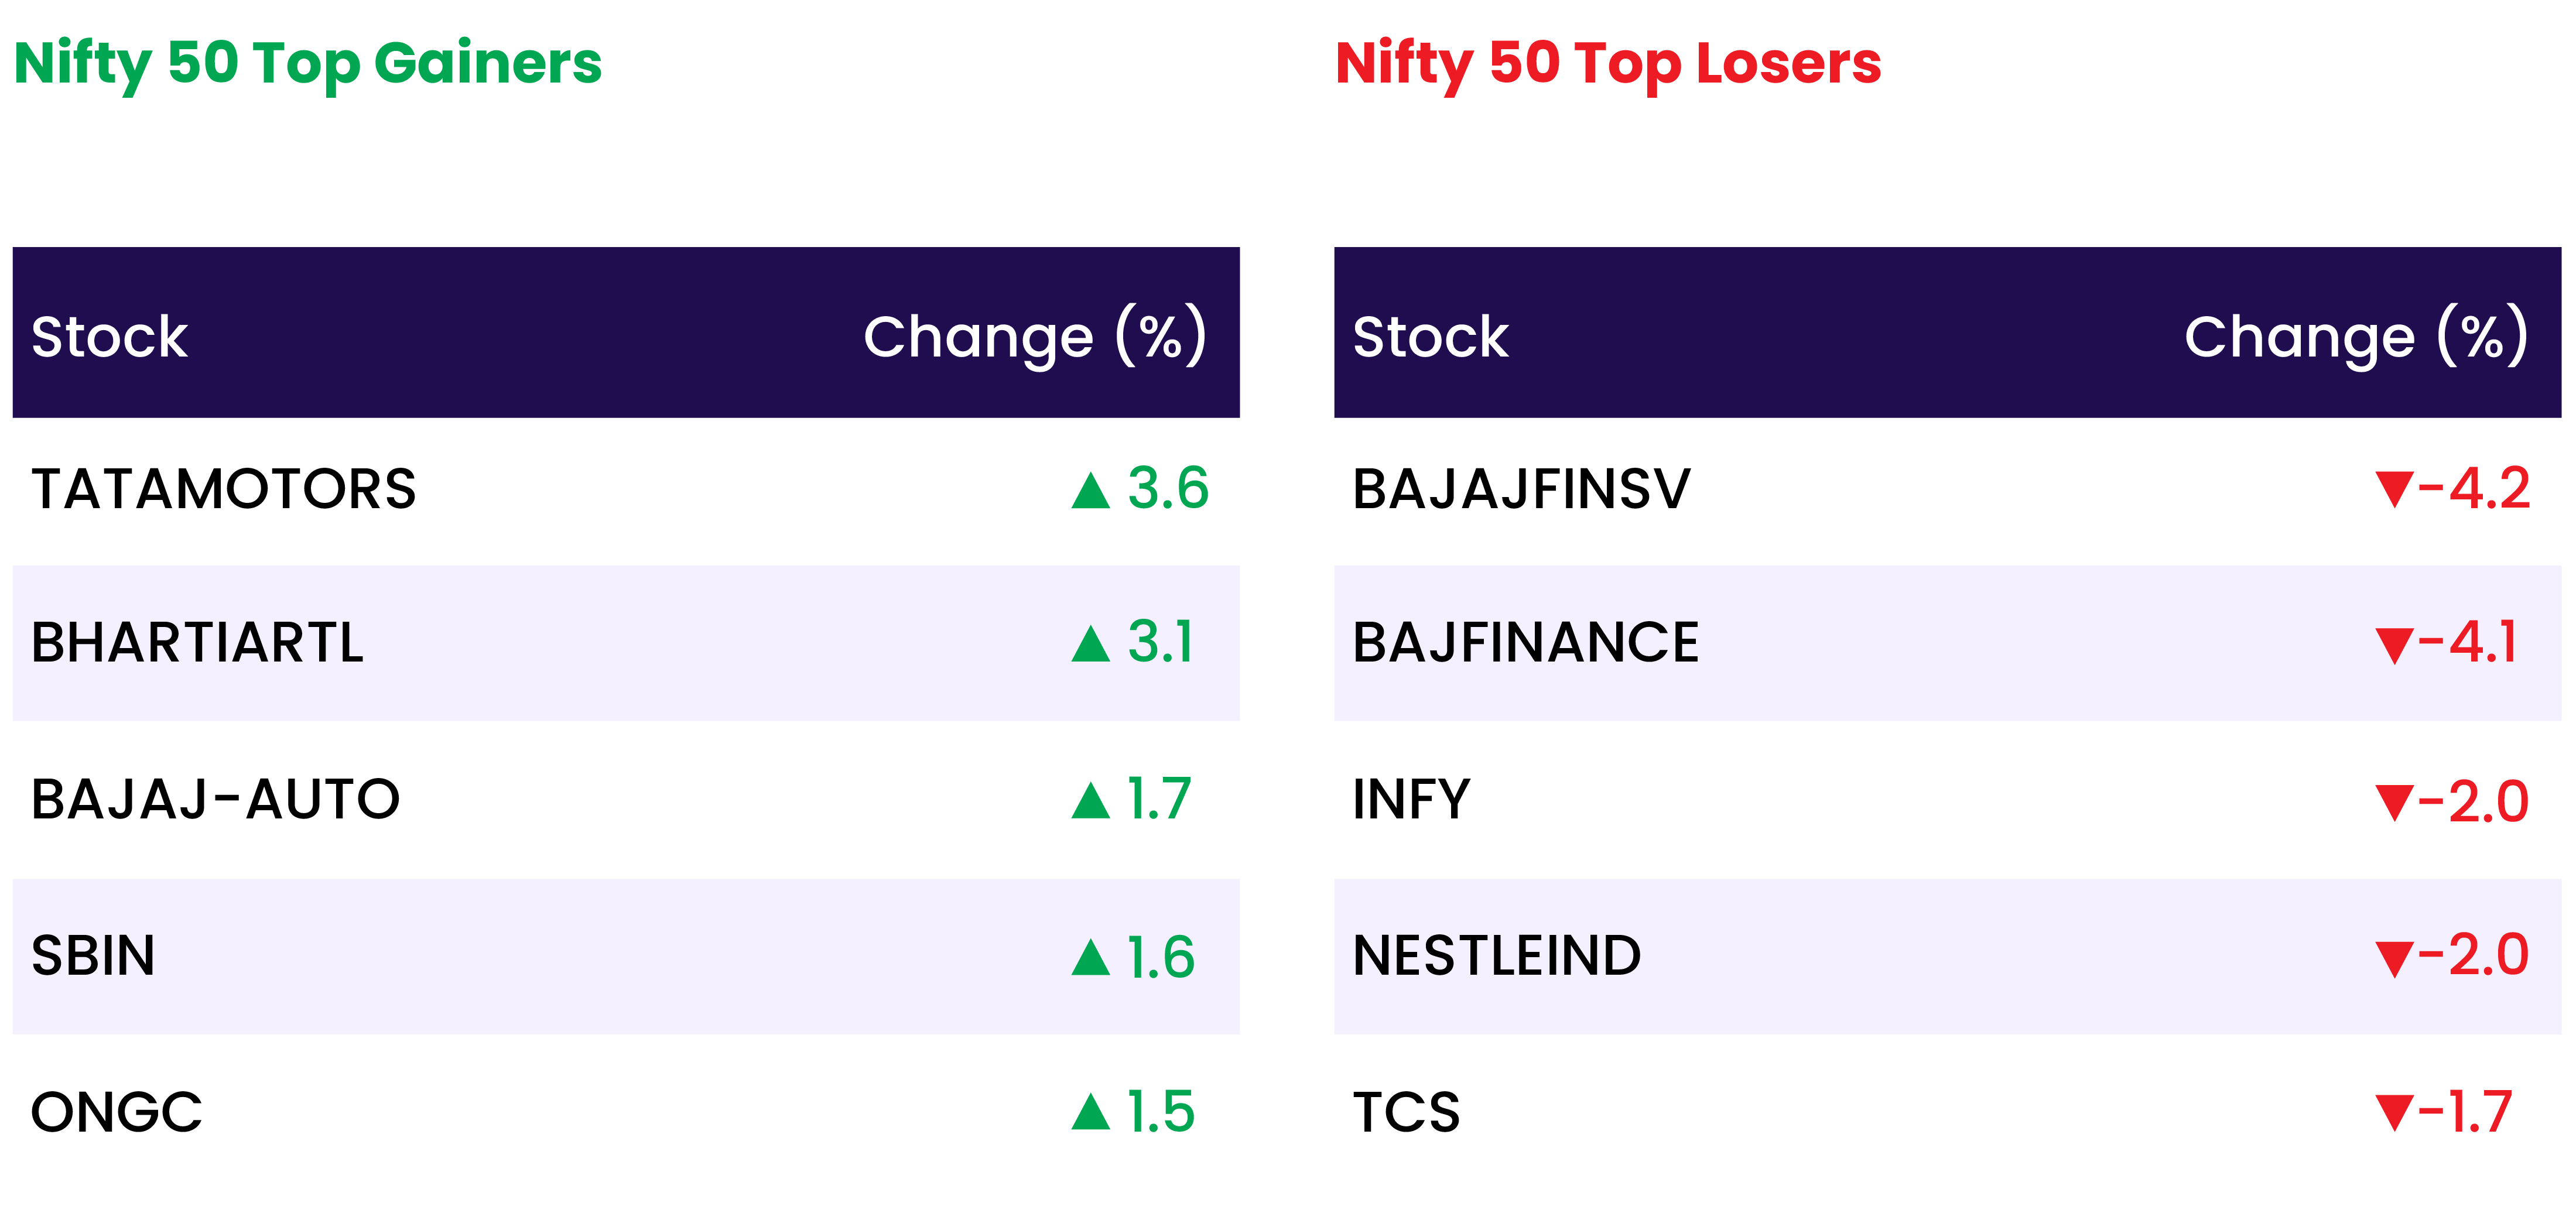
- Tata Motors shares surged by 3.59 percent following the company’s announcement to separate its passenger and commercial vehicle businesses. Brokerages highlighted that this move is expected to unlock value for both the company and its investors.
- Paytm stocks experienced a 3.16 percent decline, with 58.2 lakh shares, equivalent to 0.92 percent of equity, changing hands. According to a CNBCTV18 report, equity worth Rs 241 crore was traded at an average price of Rs 414 per share.
- IIFL Finance witnessed a significant downturn of 19.99 percent, triggering the lower circuit, after the RBI instructed the company to halt the sanctioning or distribution of gold loans due to substantial supervisory concerns.
News from the IPO world🌐
- Shares worth $21 billion to enter market in 4 months as IPO lock-in period expires for 66 companies
- Snacks IPO price band fixed at Rs 381-401/share; issue to open on March 6
- Sebi clears Fairfax-backed Digit’s IPO after delay, letter shows
Daily Leader board:

Sectoral Performance
| Top Sectors | Day change (%) |
| NIFTY PSU BANK | 2.6 |
| NIFTY AUTO | 1.4 |
| NIFTY OIL & GAS | 0.5 |
| NIFTY PHARMA | 0.3 |
| NIFTY REALTY | 0.3 |
Advance Decline Ratio
| Advance/Declines | Day change (%) |
| Advances | 1262 |
| Decline | 2579 |
| Unchanged | 92 |
Numbers to track
| Indices Name | Latest | % 1D | % YTD |
| Dow Jones (US) | 38,990 | (0.3) % | 3.4 % |
| 10 Year Gsec India | 7.1 | 0.0 % | (1.6) % |
| WTI Crude (USD/bbl) | 80 | 2.2 % | 13.6 % |
| Gold (INR/10g) | 63,112 | (0.0) % | 1.6 % |
| USD/INR | 82.84 | (0.1) % | (0.3) % |
Please visit www.fisdom.com for a standard disclaimer


