
Technical Overview – Nifty 50

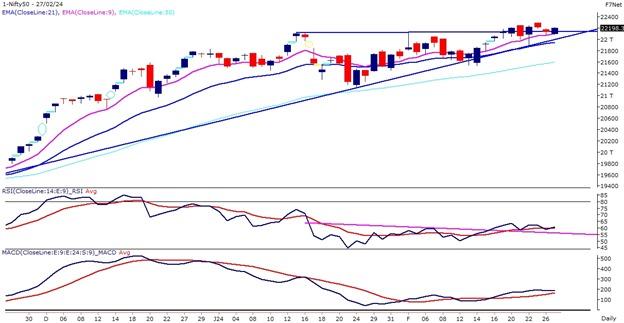
It was again a volatile day for the Nifty50 where prices traded within its previous week’s range and continued to hover near breakout levels on the daily chart. The index formed a bullish candle on the daily chart but was not able to surpass its consolidation range.
Technically the Index is hovering near the breakout levels on the daily chart and the volatility factor is getting impacted. Overall, the index is trading above its 9, 21, and 50 EMA on the daily chart, adding a safety cushion for the prices. The momentum oscillator RSI (14) is hovering near 60 levels suggesting a bullish to sideways stand.
On the contrary, the line in the sand is at Nifty’s make-or-break support at the 21,900 mark. We suspect that the bull case is still intact and believe that bulls will regroup at a corrective decline.
Technical Overview – Bank Nifty

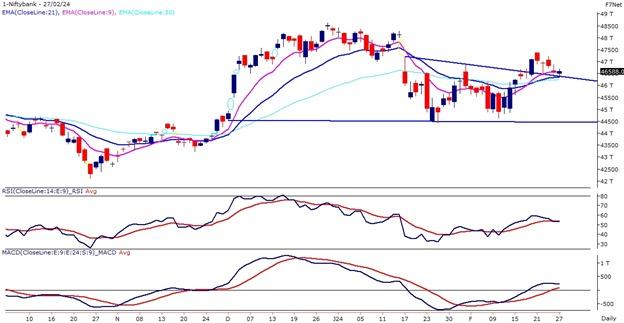
The Banking Index on the daily chart has given a triangle pattern breakout and the prices closed above the upper band of the range after facing an above-average volatility. Post breakout the Banking Index has completed the throwback near the breakout levels.
The prices on the weekly time frame are trading above their 21 and 50 EMA and it is taking support near the lower band of the rising wedge pattern and moving higher. The momentum oscillator RSI (14) is hovering near 50 levels suggesting a bullish to sideways stand.
Technically speaking, Bank Nifty’s technical picture on the daily chart shifts to bullish from neutral amidst bullish breakout technical conditions on the daily charts. Immediate support for now is near 46,200 levels while resistance is near 47,200 levels.
Indian markets:
- The Sensex and Nifty 50, key domestic stock market indicators, concluded Tuesday’s trading session on a positive note despite volatility.
- The uptrend was driven by gains in sectors such as information technology (IT), auto, pharmaceuticals, and real estate.
- Investors closely monitored significant economic data from both the United States and India. Analysts maintain an optimistic outlook, anticipating no adverse developments in the domestic markets. Expectations are high, with the belief that favorable macroeconomic indicators, including the anticipated positive performance of the US GDP, will propel the markets to new highs in the upcoming days.
- Among sectors, Auto, Capital Goods, Information Technology, Pharma, Realty up 0.5-1 percent each, while Oil & Gas index was down one percent.
Global Markets:
- On Tuesday, Asian shares faced challenges as slightly higher-than-expected Japanese inflation raised concerns among investors ahead of upcoming price data in Europe and the U.S.
- The yen stabilized at 150.57 against the dollar, rebounding from a three-month low against the euro. Despite Japanese inflation meeting the central bank’s 2% year-on-year target, expectations persisted that it would exit negative rates by April.
- Tokyo’s Nikkei inched up by 0.4%, reaching a new record high, while MSCI’s Asia-Pacific index outside Japan remained flat, staying below last week’s seven-month peak. Overnight, Wall Street indexes declined, with S&P 500 and Nasdaq futures dipping 0.1% in morning trade.
Stocks in Spotlight
- Oil India witnessed a significant surge of 12.4 percent driven by a bullish production outlook. According to brokerage house Motilal Oswal, Oil India’s production growth guidance remains strong, bolstered by increased drilling activity and development wells in existing areas. This positive assessment contributed to the notable uptick in Oil India’s stock price.Top of Form
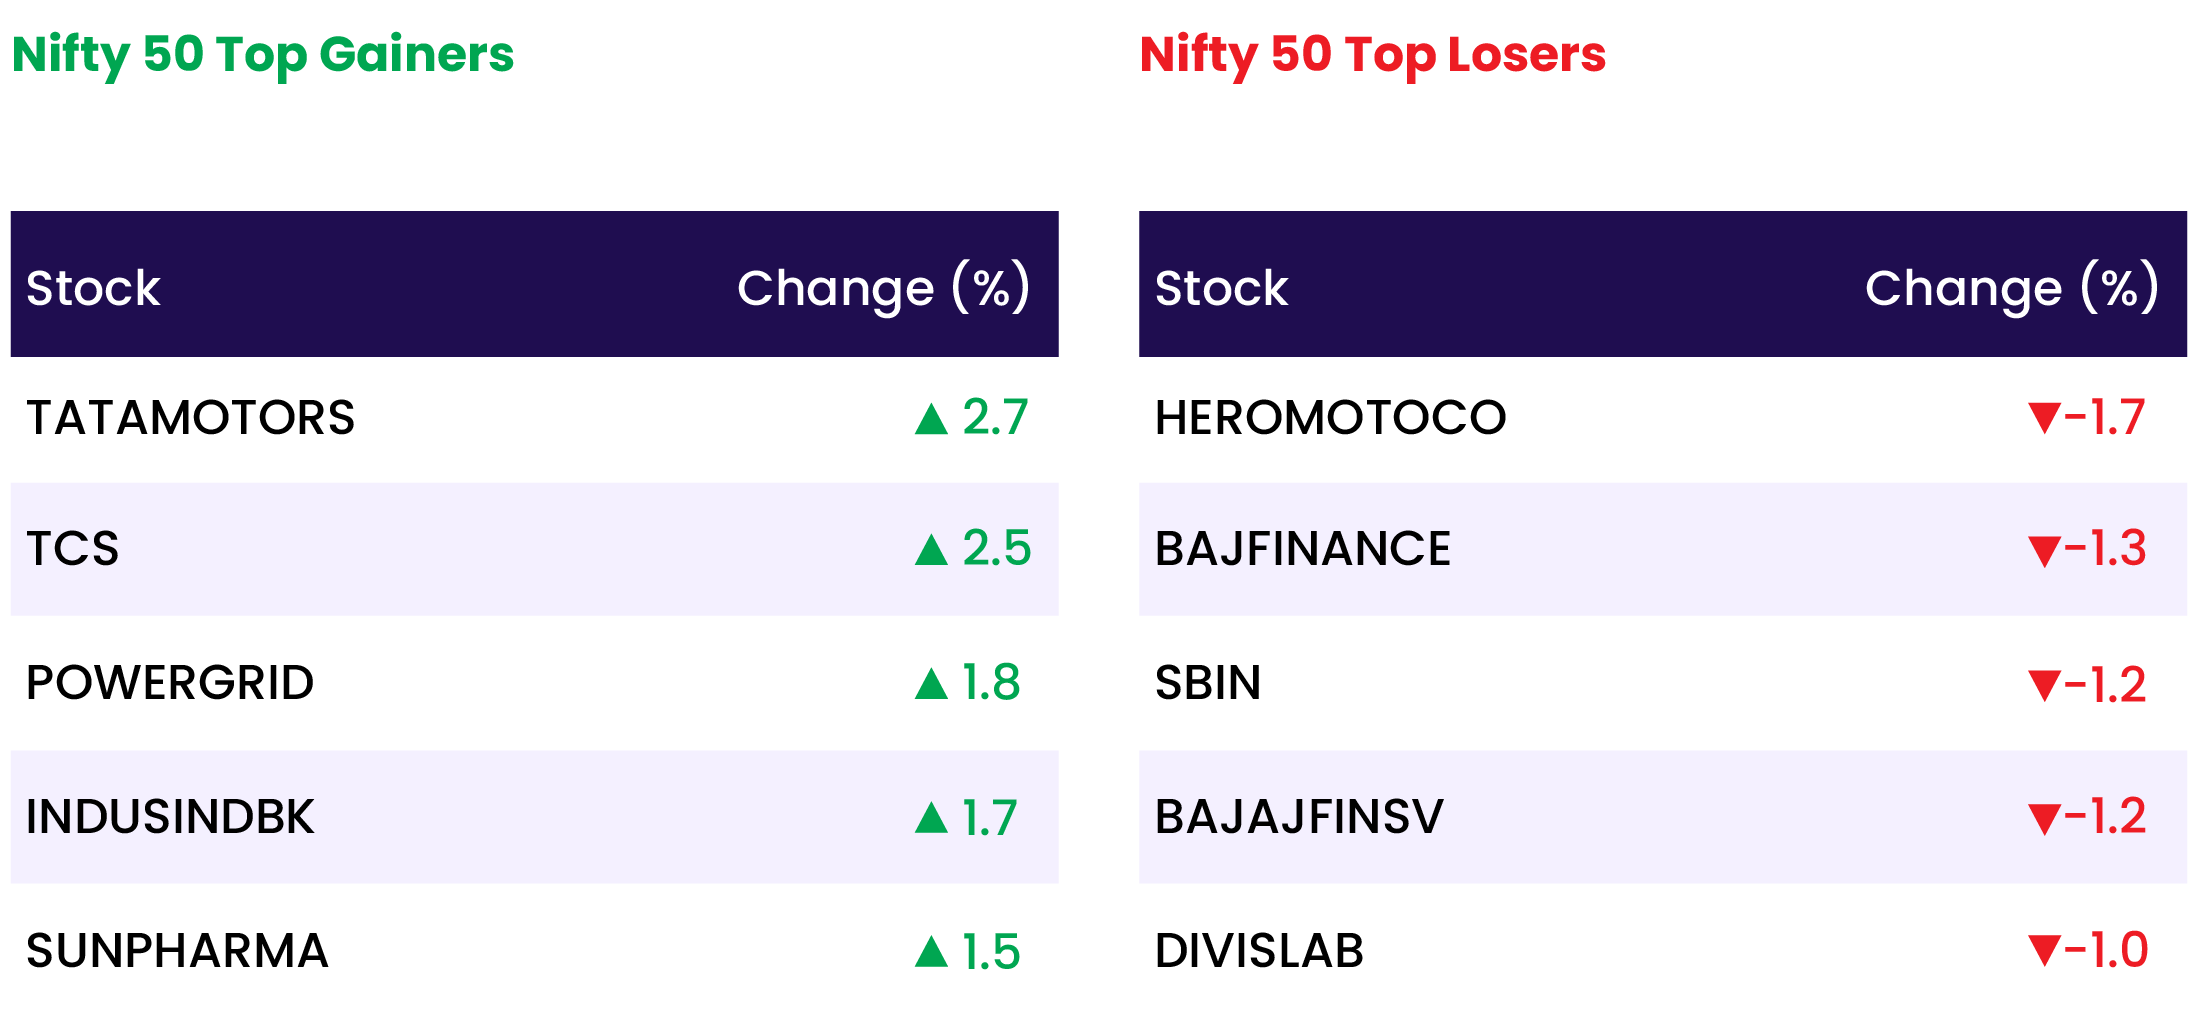
- TCS shares rose by 2.49 percent following an upgrade from global brokerage firm UBS, shifting the stock’s rating from ‘neutral’ to ‘buy’ and increasing the target price from Rs 4,000 to Rs 4,700. UBS foresees TCS taking the lead, anticipating margin improvements by F25. The stock is currently positioned at the lower range of its long-term trading valuation premium relative to its industry peers, according to UBS.
- Havells India surged 3.31 percent after Goldman Sachs upgraded the stock to “buy”, viewing the company’s cost control methods positively, including the strategic move to shift outsourcing to its manufacturing facilities.
- Olectra Greentech experienced a 2.76 percent decline as investors took profits, following the stock’s previous session gains driven by securing a Rs 4,000 crore contract from Brihanmumbai Electricity Supply and Transport Undertaking (BEST) for the provision, operation, and maintenance of 2,400 electric buses.Top of Form
- CMS info Systems stock fell 2.52 percent after 4.2 crore shares changed hands through a block deal on February 27. CNBC Awaaz reported that promoter Sion likely sold its entire stake of 26.7 percent in the company.
News from the IPO world 🌐
- Tata Group eyes mega $1-2 billion IPO for its EV business
- RK Swamy to launch IPO on Mar 4
- Exicom Tele Systems IPO fully subscribed on Day 1
Daily Leader board:

Sectoral Performance
| Top Sectors | Day change (%) |
| NIFTY REALTY | 1.1 |
| NIFTY CONSUMER DURABLES | 0.9 |
| NIFTY IT | 0.7 |
| NIFTY AUTO | 0.7 |
| NIFTY HEALTHCARE INDEX | 0.7 |
Advance Decline Ratio
| Advance/Declines | Day change (%) |
| Advances | 1536 |
| Decline | 2301 |
| Unchanged | 92 |
Numbers to track
| Indices Name | Latest | % 1D | % YTD |
| Dow Jones (US) | 39,069 | (0.2) % | 3.6 % |
| 10 Year Gsec India | 7.1 | 0.4 % | (1.5) % |
| WTI Crude (USD/bbl) | 78 | 1.4 % | 10.2 % |
| Gold (INR/10g) | 61,895 | 0.2 % | (1.3) % |
| USD/INR | 82.88 | 0.0 % | (0.2) % |
Please visit www.fisdom.com for a standard disclaimer


