

Technical Overview – Nifty 50

The Nifty50 continued its bullish momentum for the fifth straight day traded convincingly above 22,150 levels and formed a bullish candle on the daily chart. A positive start most likely for the benchmark Nifty and any move above Nifty’s all-time-high could lure more buyers to the trading floor, who together then can manage Nifty to climb towards Nifty’s 22500 mark.
The Benchmark index on the 120 mins chart has given a cup and handle pattern breakout and the prices have closed marginally above the neckline of the pattern. The momentum oscillator RSI (14) on the daily chart has moved above 60 levels with a bullish crossover.
The index has formed a bullish engulfing pattern on weekly charts. On Friday, Nifty Futures closed higher, driven by increased long positions in cumulative Open Interest (OI). The India VIX has inched at 16 levels indicating a highly volatile trading session ahead of elections. Looking ahead, Nifty needs to sustain above 22,200 for an up move to 22,500, with 21,950 acting as a strong support level in case of a downturn.
Technical Overview – Bank Nifty
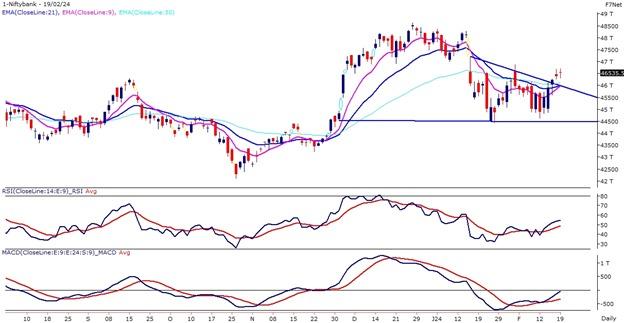
The Bank Nifty on the daily chart has given a triangle pattern breakout and prices have closed above the same suggesting a continuation of a bullish trend. It was overall a volatile day but prices managed to close in green with bullish bias in some PSU Banks.
In the previous week, the Banking index rose with a gain of more than 1.50% and formed a bullish candle on the weekly chart. The Banking index is presently trading above its 9, 21, and 50 EMA on the daily chart and the slope of the averages is tilted higher.
Technically speaking, Bank Nifty’s technical picture on the daily chart shifts to bullish from neutral amidst bullish breakout technical conditions on the daily charts. Immediate support for now is near 45,600 levels while resistance is near 47,000 levels.
Indian markets:
- The market extended its upward trajectory for the fifth consecutive session on February 19.
- Nifty achieved a new all-time intraday high of 22,186.65 during the trading day.
- Despite mixed global cues, the market opened on a positive note.
- Initial trading hours saw fluctuations as the market alternated between gains and losses.
- However, strong buying activity in various sectoral indices and heavyweight stocks propelled the market to close near the day’s peak levels.
Global Markets:
- Asia-Pacific markets rebounded after experiencing mostly declines on Wednesday, although Japan faced challenges as it entered a technical recession with its GDP contracting for a second consecutive quarter.
- Japan’s GDP for the fourth quarter declined by 0.4% on an annualized basis, significantly below the 1.4% growth anticipated by economists surveyed by Reuters, following a 3.3% contraction in the third quarter.
- Oil prices retreated on Friday due to a forecast indicating slowing demand by the International Energy Agency, countering support from geopolitical tensions and optimism regarding the possibility of the U.S. Federal Reserve implementing interest rate cuts sooner than previously expected.
Stocks in Spotlight
- Oil India witnessed a significant surge of 12.4 percent driven by a bullish production outlook. According to brokerage house Motilal Oswal, Oil India’s production growth guidance remains strong, bolstered by increased drilling activity and development wells in existing areas. This positive assessment contributed to the notable uptick in Oil India’s stock price.Top of Form
- CRISIL shares experienced a significant surge of over 8 percent following the announcement of the rating agency’s financial results for the December quarter. The company reported an impressive 33 percent year-on-year increase in consolidated net profit, reaching Rs 210.1 crore, attributed to robust operating performance. Additionally, revenue showed a notable growth of 11.6 percent year-on-year, amounting to Rs 917.7 crore. Over the preceding six months, CRISIL’s stock demonstrated a remarkable gain of over 24 percent, surpassing the 12 percent rise observed in the frontline Nifty index.
- Dr. Reddy’s Laboratories saw a rise of over 2 percent, reaching a 52-week high of Rs 6,453.95, following reports by CNBC-TV18 indicating the company’s interest in acquiring Novartis AG’s stake in Novartis India. Dr. Reddy’s management has previously expressed interest in acquiring a domestic-focused portfolio during recent earnings calls. Novartis AG, a Switzerland-based pharmaceutical giant, initiated a strategic review of its subsidiary, Novartis India, on February 16. This review will encompass Novartis AG’s 70.68 percent shareholding in its Indian arm.
- Rail Vikas Nigam Ltd (RVNL) witnessed a significant surge of 12 percent following the announcement that its order book had reached Rs 65,000 crore. The state-run company disclosed its intentions to explore projects in offshore markets, particularly in Central Asia, the UAE, and Western Asia. Among its diverse portfolio, RVNL highlighted the significant contributions from projects such as Vande Bharat trains, accounting for around Rs 9,000 crore, and various Metro projects totaling Rs 7,000 crore.
News from the IPO world🌐
- IPO bound Ola Electric slashes prices of e-scooters by up to Rs. 25000
- Hyundai seeks expansion higher valuation with India IPO
- Ullu Digital files papers for Rs. 135-150 crore IPO biggest ever for an SME
Daily Leader board:

Sectoral Performance
| Top Sectors | Day change (%) |
| NIFTY CONSUMER DURABLES | 1.87 |
| NIFTY PHARMA | 0.88 |
| NIFTY FMCG | 0.79 |
| NIFTY OIL & GAS | 0.55 |
| NIFTY HEALTHCARE INDEX | 0.53 |
Advance Decline Ratio
| Advance/Declines | Day change (%) |
| Advances | 2430 |
| Decline | 1537 |
| Unchanged | 136 |
Numbers to track
| Indices Name | Latest | % 1D | % YTD |
| Dow Jones (US) | 38,623 | (0.4) % | 2.4 % |
| 10 Year Gsec India | 7.1 | 0.2 % | (0.5) % |
| WTI Crude (USD/bbl) | 78 | (1.3) % | 8.6 % |
| Gold (INR/10g) | 61,498 | 0.3 % | (2.0) % |
| USD/INR | 83.0 | 0.0 % | (0.0) % |
Please visit www.fisdom.com for a standard disclaimer


