Daily Snippets
Date: 18th January 2024 |
|
|
Technical Overview – Nifty 50 |
|
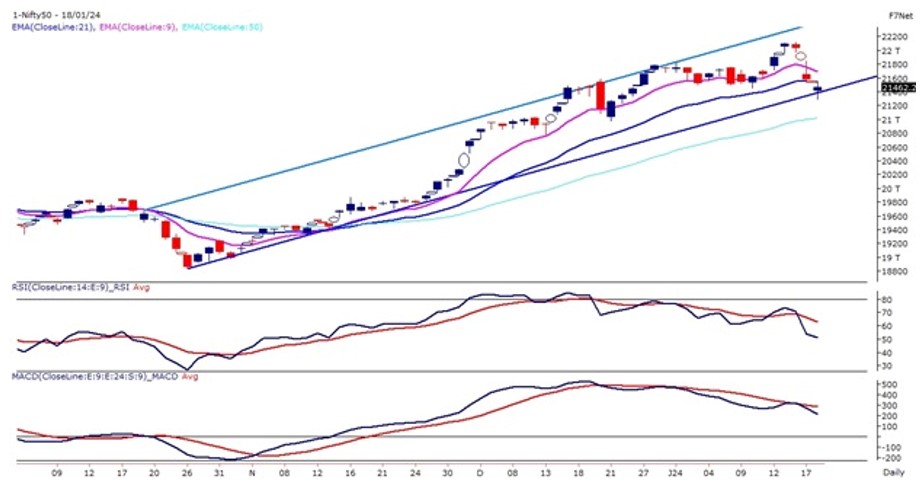
It was again a volatile day for the Benchmark index where prices witnessed a gap-down opening following its previous day’s momentum and registered its day low near 21,300 levels post that Nifty witnessed a sharp reversal from the lower levels and prices have formed a spinning top candle stick pattern on the daily chart.
The Benchmark Index on the daily chart is trading within the rising channel pattern and prices have taken support near the lower band of the pattern. The Index continues to trade in a higher high higher low formation on the daily scale which indicates bullish trend is still intact.
The momentum oscillator RSI (14) has formed a bearish divergence on the daily chart near 70 levels and oscillator drift below 60 levels with a bearish crossover on the cards. The Nifty has drifted below its 9 EMA and the prices have tilted lower.
The immediate support for the index is placed near the lower band of the rising channel pattern at 21,300 levels. The resistance is likely to be capped near 21,700 levels.
|
Technical Overview – Bank Nifty |
|
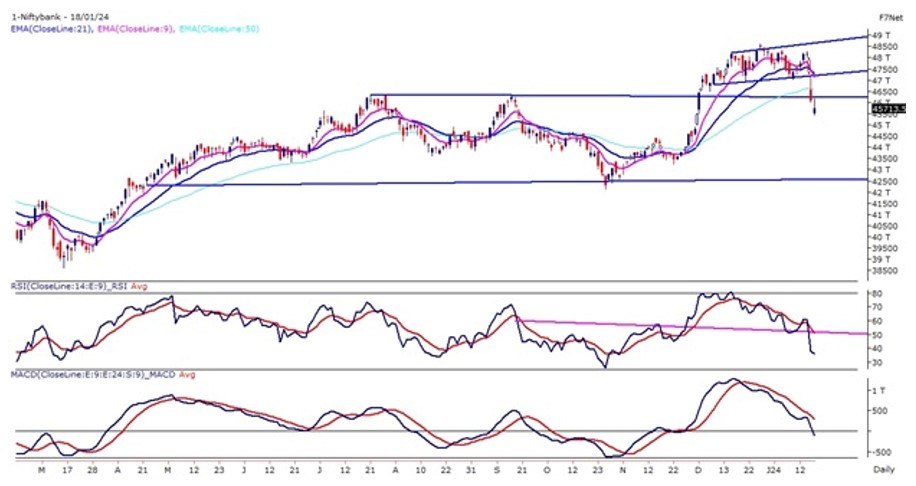
The Bank Nifty continued its bearish move and prices continued to drift lower with super volatility on the cards. The Bearish dead cross has been marked on the daily chart where 9 EMA and crossed below 21 EMA which bears are in control.
On the weekly chart, the index has already lost more than 4 percent and tested its 21 EMA which is placed at 45,700 levels. The Banking index has come closer to refilling its gap created near 45,000 levels. The momentum oscillator RSI (14) is reading in a lower high lower low formation below 40 levels with bearish crossover. The Index has also closed below its 9 & 21 EMA and the averages have sloped lower.
The MACD indicator has given a bearish crossover above its line of polarity. The immediate support for the Bank Nifty stands at 45,000 and resistance is capped below 46,500 – 46,800 levels.
|
Indian markets:
- The equity market witnessed a third consecutive day of a downward trend.
- Selling pressure on banks and IT stocks played a significant role in influencing the market decline.
- Despite a mid-session rebound, the Nifty50 displayed notable volatility throughout the day. The market closed below the critical 21,500 level. Trading exhibited volatility due to the expiry of weekly index options on the NSE.
- Sectors such as IT, banking, and metal faced losses, counterbalancing the strength observed in pharma and realty.
|
Global Markets
- Shares in Europe and Asia advanced on Thursday, as investors continue to monitor news and comments from the World Economic Forum in Davos, Switzerland.
- China’s economy expanded by 5.2% in the fourth quarter of 2023, missing estimates.
- Wall Street stocks finished lower on Wednesday after upbeat December US retail sales data eroded expectations the Federal Reserve will kick off its rate-cut campaign as early as March.
|
Stocks in Spotlight
- Oracle Financial Services saw a surge of 27.4 percent in its shares following a remarkable performance, with the company’s net profit soaring by almost 70 percent year-on-year to Rs 740.8 crore. Additionally, there was a substantial 26 percent increase in revenue from operations, reaching Rs 1,823.6 crore.
- IndusInd Bank, a private sector lender, announced a net profit of Rs 2,301 crore for the October-December quarter of the financial year 2023-24. This reflects a growth of 17.1 percent compared to Rs 1,963.64 crore reported in the corresponding period of the previous year. The bank’s gross (NPA) decreased to 1.92 percent from 2.06 percent in the same quarter last year. Concurrently, the net NPA for the quarter improved to 0.57 percent, showcasing a positive trend from 0.662 percent on a year-on-year basis.
- Jindal Stainless Ltd (JSL) on Thursday posted a 35 per cent rise in its consolidated net profit to Rs 691.22 crore during the December quarter, aided by trimmed expenses. Its net profit was at Rs 512.62 crore during the October-December period of the preceding 2022-23 fiscal, the company said in a regulatory filing.
|
News from the IPO world🌐
- Nova AgriTech IPO price band fixed at Rs 39-41 per share
- Epack Durable IPO price band set at Rs 218-230/share
- Capital SFB, Krystal Integrated Services and Vibhor Steel get Sebi nod to launch IPOs
|
|
Day Leader Board
Nifty 50 Top Gainers | Stock | Change (%) | | SUNPHARMA | ▲ 2.9 | | TECHM | ▲ 2.4 | | CIPLA | ▲ 2 | | TATAMOTORS | ▲ 1.7 | | M&M | ▲ 1.2 |
| Nifty 50 Top Losers | Stock | Change (%) | | LTIM | ▼ -10.7 | | NTPC | ▼ -3.1 | | HDFCBANK | ▼ -3.1 | | TITAN | ▼ -2.4 | | POWERGRID | ▼ -2.3 |
| |
Sectoral Performance | Top Sectors | Day change (%) | | NIFTY PHARMA | 1.03 | | NIFTY PSU BANK | 0.81 | | NIFTY REALTY | 0.72 | | NIFTY HEALTHCARE INDEX | 0.63 | | NIFTY OIL & GAS | 0.6 |
|
Advance Decline Ratio | Advance/Declines | Day change (%) | | Advances | 1793 | | Declines | 2024 | | Unchanged | 93 |
|
Numbers to track | Indices Name | Latest | % 1D | % YTD | | Dow Jones (US) | 37,267 | (0.3) % | (1.2) % | | 10 Year Gsec India | 7.2 | 0.20% | 0.10% | | WTI Crude (USD/bbl) | 73 | (0.2) % | 3.1 % | | Gold (INR/10g) | 61,751 | 0.30% | 0.50% | | USD/INR | 83.04 | 0.2 % | (0.0) % |
|
|
Please visit www.fisdom.com for a standard disclaimer.
|

