Daily Snippets
Date: 17th January 2024 |
|
|
Technical Overview – Nifty 50 |
|
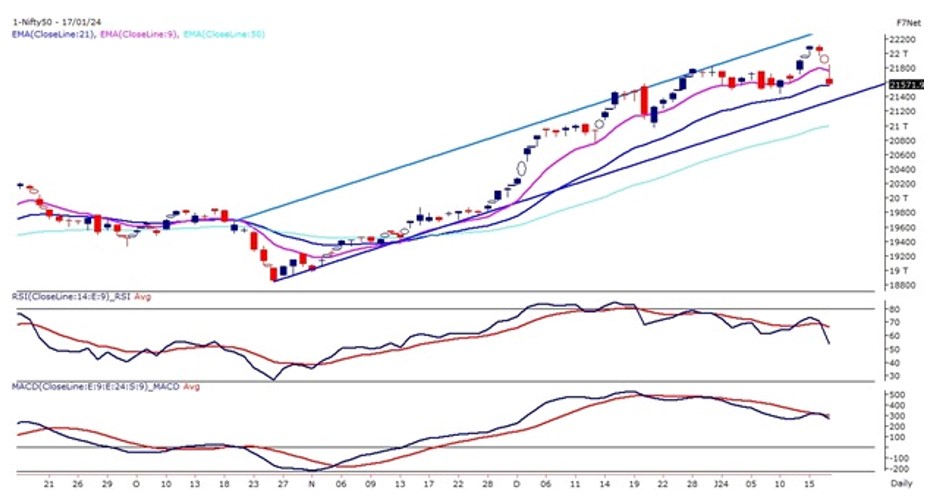
The Benchmark Index on 17th January witnessed a massive selling and drifted more than 1.50 percent daily, forming a tall bearish candle on the daily chart. The Nifty50 on the daily chart has formed a bearish island reversal pattern on the top and prices have drifted lower.
The momentum oscillator RSI (14) has formed a bearish divergence on the daily chart near 70 levels and oscillator drift below 60 levels with a bearish crossover on the cards. The Nifty has drifted below its 9 EMA and the prices have tilted lower.
On the weekly time frame, the Index has formed a bearish engulfing candle stick pattern at the top indicating the probability of profit booking. The immediate support for the index is placed near the lower band of the rising channel pattern at 21,400 levels. The resistance is likely to be capped near 21,800 levels.
|
Technical Overview – Bank Nifty |
|
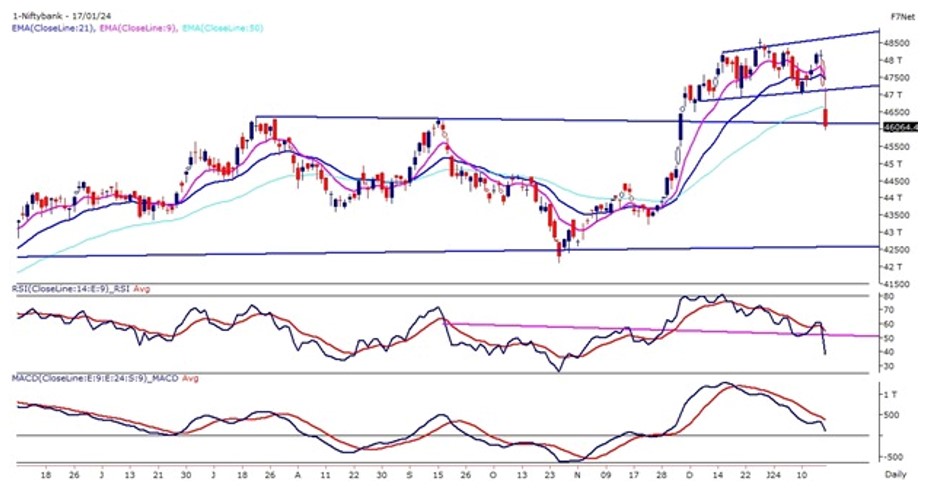
The Hardcore selling was witnessed in the Banking index and the index formed a super tall bearish candle on the daily chart with a fall of more than 4% in the day. The Bank Nifty on the daily chart has witnessed a rectangle pattern breakdown and closed below the same.
The momentum oscillator RSI (14) is reading in a lower high lower low formation below 40 levels with bearish crossover. The Index has also closed below its 9 & 21 EMA and the averages have sloped lower.
The Banking index has filled its previous runaway gaps and is likely to take immediate support at current levels. The MACD indicator has given a bearish crossover above its line of polarity. The immediate support for the Bank Nifty stands at 45,700 and resistance is capped below 46,600 – 46,900 levels.
|
Indian markets:
- Key equity benchmarks experienced a second consecutive day of decline on Wednesday.
- The selloff was primarily attributed to a significant drop in private banking stocks, particularly HDFC Bank.
- HDFC Bank’s share price fell by over 8% following the release of its Q3 earnings.
- The Nifty50 closed below the critical 21,600 level as a result of the selloff.
- Global market signals, indicating adverse trends, further prompted profit selling in the market.
- The NSE’s India VIX, a measure of market expectations for volatility in the near term, saw a notable surge of 11.10% to reach 15.08%.
|
Global Markets
- The Dow Jones index futures were down 165 points, indicating a weak opening in the US stocks today.
- Markets in Europe and Asia tumbled on Wednesday, on increased uncertainty over the likelihood of early interest rate cuts as well as disappointing Chinese growth data.
- China’s economy grew by 5.2% in the October to December period last year, China’s National Bureau of Statistics said Wednesday. GDP climbed 5.2% for the whole of 2023.
- U.S. markets dropped on Tuesday as bond yields ticked higher and Wall Street pored through the latest batch of fourth-quarter earnings. Federal Reserve Governor Christopher Waller indicated in a speech that the central bank could ease monetary policy slower than anticipated.
|
Stocks in Spotlight
- HDFC Bank experienced an 8.16% decline in its shares following the release of Q3 results, which fell short of market expectations. Despite a 33% growth in net profits that met predictions, the increase was driven by a one-time tax gain. Additionally, the bank’s net interest income rose by 24% but failed to meet street estimates.
- ICICI Lombard saw a 5% increase in its shares as a result of the company surpassing market expectations in its Q3 results. The company reported a net premium income of Rs 4,690 crore, exceeding market predictions of Rs 4,376 crore. Furthermore, its combined ratio decreased to 103.6 percent, surpassing estimates of 104%.
- On January 17, Asian Paints reported a consolidated net profit of Rs 1,475.16 crore for Q3 FY 2023-24, up 34.4% YoY. The company recorded a 5.4% YoY increase in consolidated revenue at Rs 9,104 crore. Notably, the Decorative Business segment in India witnessed a 12% volume growth and a 5.5% increase in value sales. Sequentially, the profit grew by 19.69%.
|
News from the IPO world🌐
- Nova AgriTech IPO price band fixed at Rs 39-41 per share
- Epack Durable IPO price band set at Rs 218-230/share
- Capital SFB, Krystal Integrated Services and Vibhor Steel get Sebi nod to launch IPOs
|
|
Day Leader Board
Nifty 50 Top Gainers | Stock | Change (%) | | APOLLOHOSP | ▲ 1.3 | | HCLTECH | ▲ 1.1 | | TECHM | ▲ 1 | | SBILIFE | ▲ 0.9 | | LTIM | ▲ 0.7 |
| Nifty 50 Top Losers | Stock | Change (%) | | HDFCBANK | ▼ -8.2 | | TATASTEEL | ▼ -4 | | KOTAKBANK | ▼ -3.8 | | AXISBANK | ▼ -3.4 | | HINDALCO | ▼ -3.3 |
| |
Sectoral Performance | Top Sectors | Day change (%) | | NIFTY IT | 0.64 | | NIFTY MEDIA | -0.12 | | NIFTY CONSUMER DURABLES | -0.16 | | NIFTY HEALTHCARE INDEX | -0.69 | | NIFTY FMCG | -0.87 |
|
Advance Decline Ratio | Advance/Declines | Day change (%) | | Advances | 1224 | | Declines | 2602 | | Unchanged | 74 |
|
Numbers to track | Indices Name | Latest | % 1D | % YTD | | Dow Jones (US) | 37,361 | (0.6) % | (0.9) % | | 10 Year Gsec India | 7.2 | 0.30% | -0.10% | | WTI Crude (USD/bbl) | 73 | 0.9 % | 3.3 % | | Gold (INR/10g) | 62,074 | 0.00% | 0.20% | | USD/INR | 82.84 | 0.0 % | (0.2) % |
|
|
Please visit www.fisdom.com for a standard disclaimer.
|

